Our latest summary and graphs about US energy, electricity, and GDP, with data through 2025
For more than a decade, since my old friend Richard Hirsh and I wrote this article for the Electricity Journal (Hirsh and Koomey 2015), we've compiled Energy Information Administration data every year to track recent developments for the US.
This compilation can be tricky because of quirks in the data . For example, solar electricity generation "behind the meter" (i.e., in a house or business) is not counted in electricity sales, nor is it always counted under "generation", but is tracked in a separate data series. For a real estimate of both electricity use and generation the behind the meter solar needs to be added back into both series. This didn't matter much in earlier years, but nowadays the onsite solar contribution is big enough to matter and growing fast.
We've made that correction and added things up properly in our newest excel workbook, downloadable here. The data now go from 1950 through 2025. The source data are all posted at the EIA's Open Data site.
The most important top line results are contained in this graph, showing indices of energy use, electricity use, and real GDP over time (1973=1.0):
Figure 1: Indices of energy use, electricity use, and real GDP over time
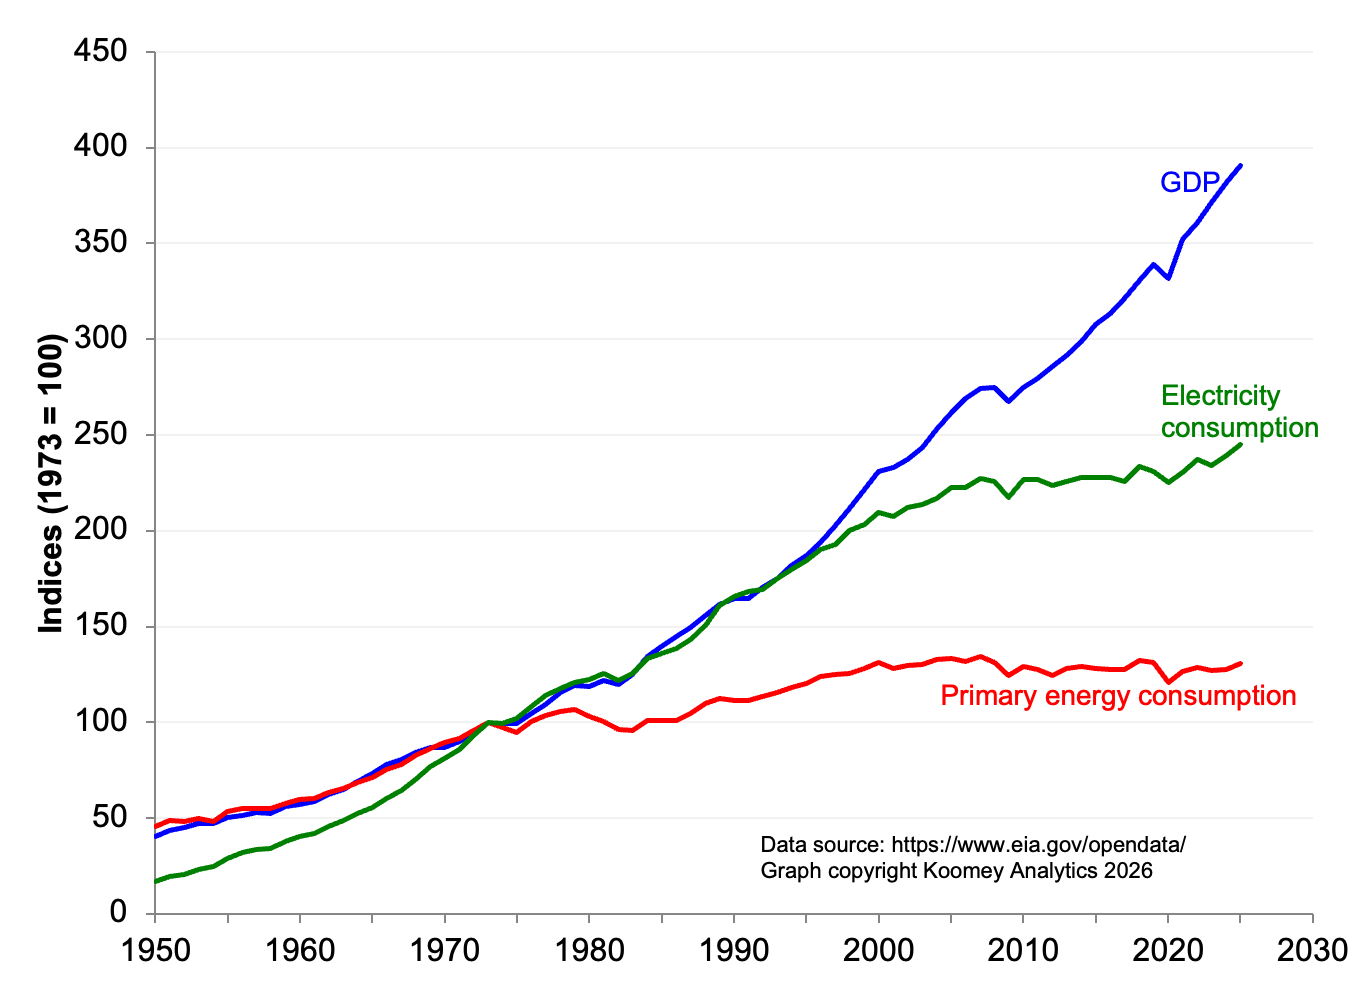
Before 1973, primary energy and Gross Domestic Product tracked closely, which is what observers in that period called "the ironclad link" between energy and GDP (Koomey 1984). Electricity consumption grew faster than GDP during that period, because the economy was electrifying.
The 1970s oil shocks broke the ironclad link between energy and GDP, and primary energy stayed more or less flat while GDP continued to grow. Electricity growth then tracked GDP growth almost exactly, until the mid-1990s, when another discontinuity arose (Davis et al. 2003). After that time electricity use and GDP appeared to "decouple", just as energy use and GDP did from the 1970s onwards.
Interestingly, the past one or two years have seen moderate growth in electricity use and "recoupling" of electricity use and GDP. From 2018 to 2023 there was zero electricity growth, but growth from 2023 to 2024 was 2.1%, and growth from 2024 to 2025 was 2.4%. Some of this growth is related to general economic activity, some to electrification, and some to the data center buildout (Koomey et al. 2025 and 2026).
This development shows up clearly in this graph, showing indices of energy use and electricity use per dollar of GDP over time (1973=1.0).
Figure 1: Indices of energy use/GDP and electricity use/GDP over time
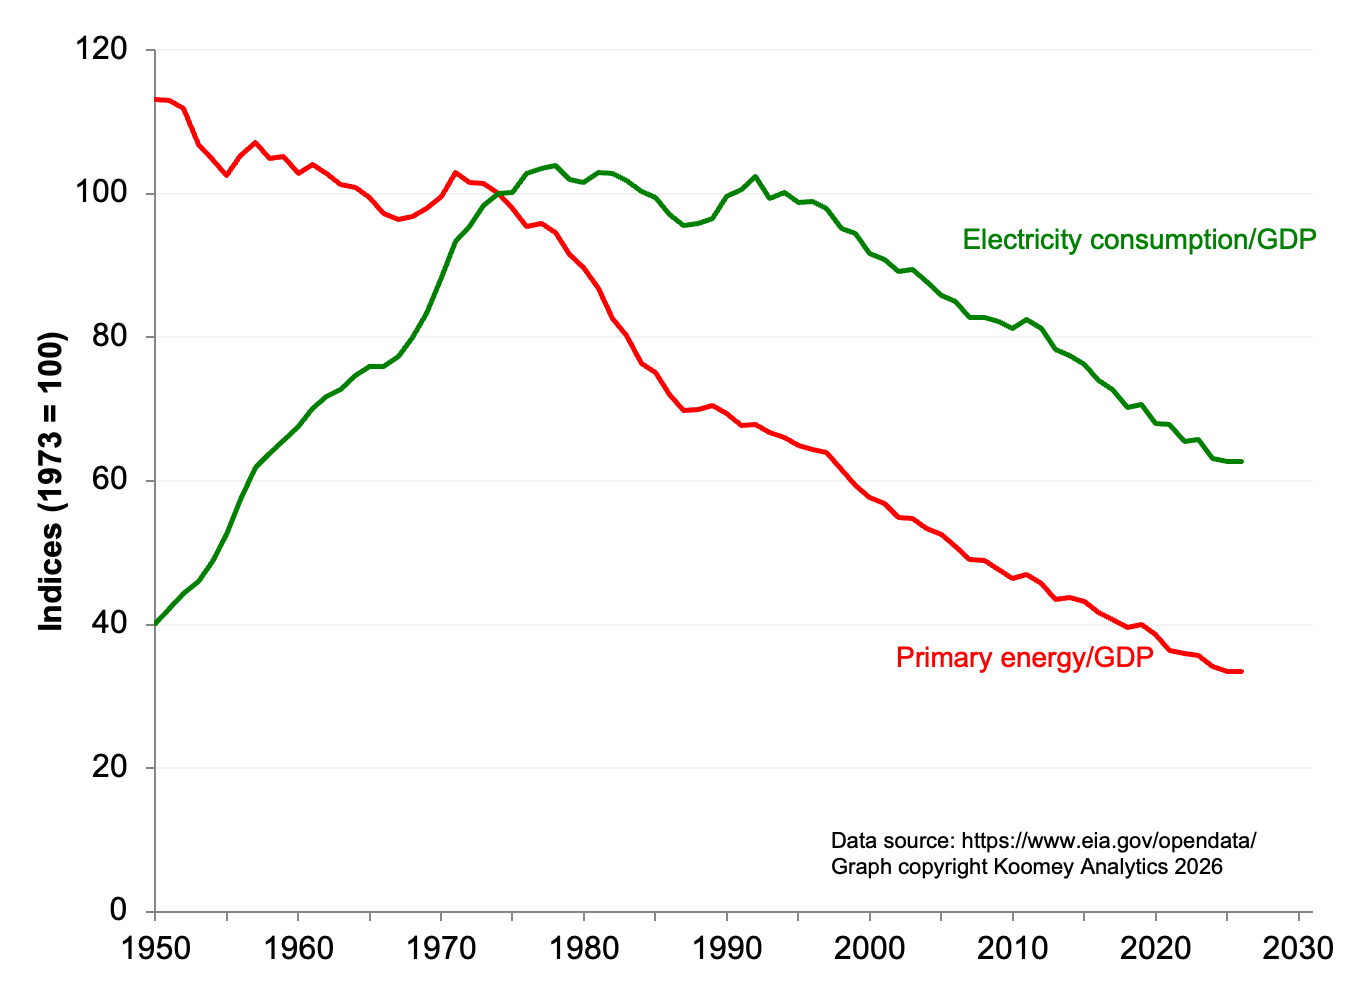
One or two years do not a trend make, but we'll need to track these data carefully going forward. There is no evidence of "explosive" growth nationally, but the last two years of growth is not uniform geographically, and some regions (particularly PJM and ERCOT) are showing much more rapid growth than others (Koomey et al. 2026).
Feel free to reuse and share these data and graphs
This workbook is made available under a Creative Commons CC BY 4.0 Attribution 4.0 International license, as described here: https://creativecommons.org/licenses/by/4.0/
If you reuse these graphs, all we ask is that you give appropriate credit, stating "This graph courtesy of Koomey Analytics, 2026", or something like that. Please don't mess with the data or equations, but if you find errors that need fixing, please contact us.
References
Davis, W. Bart, Alan H. Sanstad, and Jonathan G. Koomey. 2003. "Contributions of Weather and Fuel Mix to Recent Declines in U.S. Energy and Carbon Intensity." Energy Economics (also LBNL-42054). vol. 25, no. 4. July. pp. 375-396. [http://www.sciencedirect.com/science/article/pii/S0140988302000944]
Hirsh, Richard F., and Jonathan G. Koomey. 2015. "Electricity Consumption and Economic Growth: A New Relationship with Significant Consequences?" The Electricity Journal. vol. 28, no. 9. November. pp. 72-84. [http://www.sciencedirect.com/science/article/pii/S1040619015002067]
Koomey, Jonathan G. 1984. Energy Policy in Transition: The Rise of Conservation. A.B. Honors Thesis, History and Science Department, Harvard University.
Koomey, Jonathan, Zachary Schmidt, and Tanya Das. 2025. Electricity Demand Growth and Data Centers: A Guide for the Perplexed. Washington, DC: Bipartisan Policy Center. February. [https://bipartisanpolicy.org/report/electricity-demand-growth-and-data-centers/]
Koomey, Jonathan, Zachary Schmidt, Priya Sreedharan, Nikhil Kumar, and Taylor McNair. 2026. Separating fact from fiction in data center electricity forecasts: A guide for regulators. Bay Area, California: A joint report by Koomey Analytics and Gridlab. March. [https://gridlab.org/portfolio-item/data-center-load-forecast-report/]
