Barack Obama, Climate Hawk!
Barack Obama, Climate Hawk!
More context at http://thinkprogress.org/climate/2013/06/25/2213341/invest-divest-obama-goes-full-climate-hawk-in-speech-unveiling-plan-to-cut-carbon-pollution/
Barack Obama, Climate Hawk!
More context at http://thinkprogress.org/climate/2013/06/25/2213341/invest-divest-obama-goes-full-climate-hawk-in-speech-unveiling-plan-to-cut-carbon-pollution/
For many months I struggled with what to think about the Keystone pipeline. On the one hand, my friends in the Administration and elsewhere argued persuasively (at least on first blush) that the oil from the tar sands would be sold one way or another, so whether the pipeline was completed or not didn’t make any difference from a climate perspective. On the other hand, I was instinctively skeptical of building infrastructure to high carbon resources that we simply don’t have the luxury to burn if we hope to stabilize the climate.
What I came to realize was that the first point of view was based on a flawed framing of the problem, which led me to write the op-ed titled “The Fatal Flaw in the Case for Keystone”. The purpose of this short note is to explain the underlying intellectual roots of that framing (and the circular reasoning it engendered), so students of these matters can dig deeper and avoid making such mistakes in the future.
Neoclassical economics has taught us a lot about how economies work, but it is based on a set of assumptions that often don’t reflect economic decisionmaking in the real world. For example, most economic models assume perfect & costless information, perfect competition, no externalities, no transaction costs, and constant or decreasing returns to scale. In this world, it is sufficient to show that there’s a price difference between (for example) Alberta Tar Sands oil and similar heavy oil from other places, and to state that market forces won’t let that price difference persist. That’s, in essence, what it means to state that “the Alberta tar sands oil will be sold anyway”.
In the real world, however, information is imperfect and costly, transaction costs can be large, and increasing returns to scale are pervasive. These (and other) factors lead to what’s called “path dependence”, meaning that our choices now affect our options later. For example, if we invest in deploying mass produced technologies (like solar panels and wind turbines) we move down the learning curve, thus reducing the costs of those technologies five or ten years hence. If we deploy fewer of those devices, we don’t move as far down the learning curve and their costs in 2020 will be higher than they would be in the case where we more actively promote deployment of these technologies.
Another source of path dependence is the nature of the climate problem itself. Because the most important greenhouse gases stay in the atmosphere for a long time, it’s the cumulative emissions of greenhouse gases that matter. That means that we can emit only a fixed amount of carbon (our “carbon budget”) if we want to stay under the 2 Celsius degree warming limit that the US and other major nations accepted at Copenhagen in 2009. If we burn more high carbon fuels now, we commit ourselves to even faster reductions in emissions later (because the total carbon budget over the next century is fixed).
In the case of Keystone, path dependence matters a lot. Right now the heavy oils from the tar sands are “landlocked”, because pipeline capacity is limited. That means that the price of heavy oil from Alberta is much lower than comparable heavy oils (like those from Mexico, called Maya heavy oil). This discount can be tens of dollars per barrel, and it reflects the limited transportation options for tar sands producers to move their product to market. In the last nine months it has ranged between $20 and $40 per barrel. Building more pipelines will allow this differential to narrow and eventually close, but the rate at which it closes depends on how fast pipeline capacity is built (it is path dependent).
The idea that “tar sands oil will be sold anyway” assumes that adequate pipeline capacity will be built to allow this outcome to come to pass, so it’s circular to argue (as the State Department’s Environmental Impact Statement does) that approving Keystone XL will have no effect on the exploitation of the tar sands. Any one project will have a minimal effect, of course, but the cumulative effect of building enough pipelines for tar sands oil to make its way to market will be to allow greater exploitation of tar sands than would otherwise be possible.
The claim that tar sands oil will make its way to market one way or another is therefore dependent on the construction of additional pipeline capacity. If pipelines aren’t built, then the price differentials won’t narrow and less tar sands oil will be produced than otherwise (because the profitability of exploiting this resource would be substantially reduced). The logic in the State Department’s Environmental Impact statement about whether approving Keystone would increase exploitation of the tar sands is therefore invalid (because it’s circular).
The key issue from a climate perspective comes down to whether building more pipelines would affect the cumulative emissions from the tar sands. The State Department’s environmental impact statement comes to one conclusion, based on the circular reasoning I identify above, but the Canadian Oil Industry comes to the opposite conclusion (as I point out in the op-ed). If the construction of additional pipelines would affect the quantity of heavy oil extracted from the tar sands, then approving the Keystone XL pipeline (and any additional pipelines to the tar sands) is counter to the interests of climate protection, and the pipeline should therefore be rejected on that basis.
Addendum: Given what the President said in his climate speech today, the argument I make above should sink the Keystone XL pipeline.
Addendum #2: See these illuminating musings by Dave Roberts about President Obama’s statement about Keystone and this excellent piece by Jesse Jenkins summarizing the different possible scenarios related to Keystone. The key quote from Jenkins: "So can rail lines really scale up to ultimately handle a couple million barrels of new tar sands oil shipments per year? In many ways, the Keystone debate hinges on this question.“ This quote echoes what Robert and I discuss in the comments below, which is why I’m going to delve more into the question of whether rail is truly a substitute for pipelines.
The US State Department recently delayed their final decision about the Keystone XL pipeline, [1] which would transport heavy oil from Canada’s Alberta tar sands to US refineries on the Gulf coast. Proponents of the pipeline claim that it will create many US jobs and improve US national security, but in neither case are these benefits likely to be significant. [2] [3] They also claim (with some justification) that the pipeline would reduce the risk of local environmental damages compared to other shipping methods, but that argument assumes that the oil will flow from Alberta one way or another.
It is this last assumption that is the fatal flaw in the arguments of pipeline proponents, but it is a view that is widely shared. For example, the State Department’s 2013 Draft Supplemental Environmental Impact Statement assumes that approving the pipeline would have no effect on future production of tar sands:
Approval or denial of any one crude oil transport project, including the proposed [Keystone XL] Project, remains unlikely to significantly impact the rate of extraction in the oil sands, or the continued demand for heavy crude oil at refineries in the U.S.[4]
The legalistic focus on “any one crude oil transport project” guarantees that the tar sands will be exploited to their maximum potential. Each incremental increase in pipeline capacity by itself may not contribute much to additional tar sands production, but many pipelines to the tar sands would be approved if we study each in isolation, and a significant increase in tar sands production would be the perverse result.
Conversely, we know that constraints on pipelines to the tar sands would limit overall tar sands production, because the Canadian oil industry says so. In an explicit acknowledgement of the importance of future pipelines for increased exploitation of tar sands, the Canadian Association of Petroleum Producers recently described their forecast that Alberta oil sands production would be 2.5 million barrels per day in 2030 if “the only [pipeline] projects to proceed were the ones in operation or currently under construction”, but twice that if additional pipelines are built.[5] This conclusion was reinforced by a recent Goldman Sachs analysis of tar sands economics.[6]
Of course, Canada may approve other “in country” pipelines to Alberta, but Transcanada chose the Keystone XL pipeline route because it was the cheapest and easiest method to move heavy oil to refineries with capacity to process it. The other options must be less desirable because otherwise Transcanada would have chosen those instead. As a case in point, British Columbia recently rejected a pipeline to the Pacific that was one of the contingency routes in case Keystone XL was not approved.[7]
The tar sands are 14-20% more carbon polluting per unit of energy than traditional oil, when considering the full life-cycle of exploration, extraction, and consumption.[8] Using this fuel therefore has an opportunity cost, because it yields less energy per ton of carbon emitted than other fossil fuels like natural gas, and much less than renewable sources like solar or wind (which have emissions associated with their manufacturing, installation, and decommissioning).
We can emit a fixed amount of carbon over the next few decades and stay under the two Celsius degree warming limit that the US and other major countries accepted in 2009 at Copenhagen (that’s our “carbon budget”).[9] Contrary to the arguments of Keystone proponents, approving the pipeline (and the ones that will inevitably follow) will accelerate exploitation of the tar sands and eat up the remaining carbon budget more rapidly than would alternatives. That’s why the pipeline is counter to the interests of the US and the world, and why the US State Department should not approve its completion.
Ultimately, we’ll need to do what former CIA director Jim Woolsey recommends: turn oil into salt.[10] That formerly strategic commodity is now something we buy cheaply at the supermarket, made so by alternatives (like refrigeration) that rendered its former use in meat preservation obsolete. We need to buy time until we can more widely deploy alternatives to fossil fuels, and slowing the exploitation of tar sands is one good way to do just that.
________________________________________________
Jonathan Koomey, Ph.D., is a Research Fellow at the Steyer-Taylor Center for Energy Policy and Finance at Stanford University. He’s also the author of Cold Cash, Cool Climate: Science-based Advice for Ecological Entrepreneurs (Analytics Press, 2012) and coauthor of Energy Policy in the Greenhouse (John Wiley and Sons, 1992).
[1] State Department decision delayed to late 2013 or early 2014: http://www.reuters.com/article/2013/05/11/us-usa-keystone-delay-idUSBRE94A00T20130511
[2] the number of permanent jobs associated with operating the pipeline number in the dozens, while the direct employment from pipeline construction totals 3,900 temporary jobs lasting one to two years (US Department of State. 2013. Draft supplemental Environmental Impact Statement for the Keystone XL Project. March. [http://keystonepipeline-xl.state.gov/draftseis/index.htm], Executive Summary, p. ES-14.) In neither case is the number significant for the US economy, which created about 750,000 jobs in the first four months of 2013. http://www.bls.gov/news.release/empsit.b.htm
[3] Oil trades on a global market where supply and demand determines prices, so there is little demonstrable national security impact from substituting Canadian heavy oil for that shipped from other countries. Replacing oil with alternatives is the only sure way to reduce significantly the risks associated with oil dependency (Lovins, Amory B., E. Kyle Datta, Odd-Even Bustnes, Jonathan G. Koomey, and Nathan J. Glasgow. 2004. Winning the Oil Endgame: Innovation for Profits, Jobs, and Security. Old Snowmass, Colorado: Rocky Mountain Institute. September. [http://www.oilendgame.com])
[4] US Department of State. 2013. Draft supplemental Environmental Impact Statement for the Keystone XL Project. March. [http://keystonepipeline-xl.state.gov/draftseis/index.htm], p.1.4-1.
[5] CAPP. 2012. Crude Oil: Forecast, Markets, and Pipelines. Calgary, Canada: June. [http://www.capp.ca/forecast/Pages/default.aspx]
[6] http://online.wsj.com/article/SB10001424127887324069104578531713102125222.html
[7] http://www.guardian.co.uk/environment/2013/jun/01/tar-sands-canada-pipeline-enbridge
[8] Lattanzio, Richard K. 2013. Canadian Oil Sands: Life-Cycle Assessments of Greenhouse Gas Emissions. Washington, DC: Congressional Research Service. March 15. [http://www.fas.org/sgp/crs/misc/R42537.pdf]
[9] Koomey, Jonathan, and Florentin Krause. 2009. Why 2 degrees really matters. [http://thinkprogress.org/romm/2009/12/06/205058/copenhagen-two-degrees-warming-target/]
Koomey, Jonathan G. 2012. Cold Cash, Cool Climate: Science-Based Advice for Ecological Entrepreneurs. Burlingame, CA: Analytics Press. [http://www.analyticspress.com/cccc.html]
[10] Woolsey, R. James, and Anne Korin. 2007. “Turning Oil into Salt." National Review Online. September 25. [http://www.nationalreview.com/content/turning-oil-salt]
it was an honor to follow Al Gore on stage at Google’s “How Green is the Internet?” summit last Thursday. I worked hard on the talk, and it’s posted (along with Gore’s talk, some “rapid fire” research talks, and a wonderfully passionate talk from Eric Schmidt, for whom I have newfound respect), at this Google site: http://www.google.com/green/efficiency/industry-collaboration/

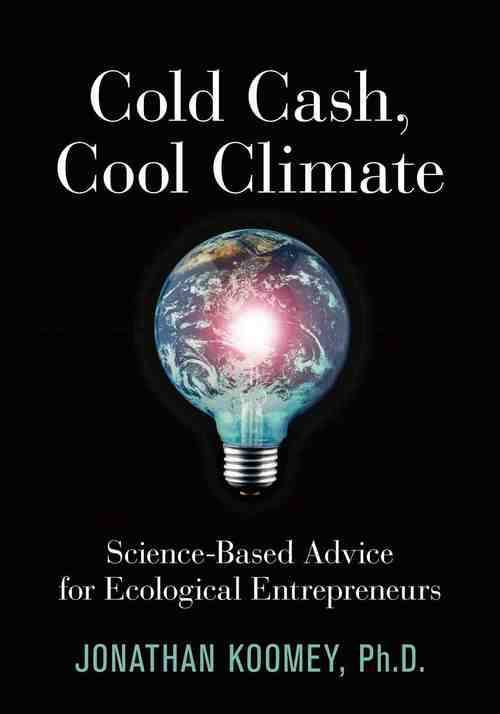
Earlier this month, my book, Cold Cash, Cool Climate: Science-based Advice for Ecological Entrepreneurs, was awarded an honorable mention in the 2013 Eric Hoffer awards, in the E-book nonfiction category. It was also a Finalist in the ‘Business: Entrepreneurship & Small Business’ category of the 2013 International Book Awards.
The data company IDC has a report out today suggesting that tablet shipments will surpass laptop shipments this year. That’s not surprising to anyone who’s been following this space, and it’s an indication (if we needed any more) that the future of computing is both mobile and ultra-low power.
Here’s the key graph:

The long-term trends in the efficiency of computing that we analyzed back in 2011 continue apace! For more on the implications of those trends, see my 2012 article in Technology Review.
The short answer: no.
The Bulletin of the Atomic Scientists just published a feature article by Nate Hultman and me that addresses this very question. All the articles in that issue are available for free during the month of May 2013–after that they go behind a paywall.
Here’s the abstract of the article, to whet your appetite:
It is tempting to attribute variations in support for nuclear power to prominent accidents such as Three Mile Island in the United States or Fukushima in Japan. To illuminate how such attribution can be problematic, the authors discuss the historical context of the Three Mile Island accident in the United States. They point out that the US nuclear industry faced major challenges even before the 1979 accident: Forty percent of all US reactor cancellations between 1960 and 2010, they write, occurred before the accident in Pennsylvania. While safety concerns were undoubtedly a driver of public aversion to new nuclear construction in the United States, the nuclear industry already faced substantial economic and competitiveness obstacles, much like the nuclear industry worldwide before Fukushima.
This was a complete update and rewrite of a much longer post Nate and I did for Koomey.com that was reposted on Climate Progress.
The full reference is Hultman, Nathan E., and Jonathan G. Koomey. 2013. “Three Mile Island: The Driver of US Nuclear Power’s Decline?" Bulletin of the Atomic Scientists. vol. 69, no. 3. May/June. pp. 63-70.[http://bos.sagepub.com/content/69/3/63.abstract]
I wasn’t able to attend Al Gore’s memorial lecture for Stephen Schneider at Stanford, but it was just posted, and it’s “must-see”. Brilliant. Moving. Powerful. Inspirational. No visuals, just a passionate and committed person speaking from his heart.
Watch it:
Al Gore @ Stanford | April 23, 2013 from Cyperus Media.com on Vimeo.
Preceding Gore’s speech is a short documentary about Steve, which captures his essential brilliance, his clarity, and his passion for truth. Don’t miss it!
After Climate Progress reposted “If we don’t change our direction we’ll end up where we’re headed”, many people asked for the graphics associated with that post, so I put a powerpoint deck online for easy download. Joe Romm also posted high resolution versions of his temperature chart in Fahrenheit and Celsius here.
Please feel free to reuse these slides for any non-commercial purpose as long as you acknowledge the source and don’t alter the graphics in any significant way (OK to change slide titles, of course). To make it all clear, I arranged a license through Creative Commons (see below). If you want to use some or all of these graphics for a commercial purpose, please email me.

Graphics showing historical and projected GHG concentrations and global temperatures by Jonathan Koomey are licensed under a Creative Commons Attribution-NonCommercial-NoDerivs 3.0 Unported License.
Based in part (slide #2 only) on a work at http://thinkprogress.org/climate/2013/03/08/1691411/bombshell-recent-warming-is-amazing-and-atypical-and-poised-to-destroy-stable-climate-that-made-civilization-possible/.
Permissions beyond the scope of this license may be available at http://www.koomey.com
Yesterday Nature Communications published an article summarizing a new innovation in battery technology that promises much higher power AND energy densities, even for very small batteries. Batteries are usually good at delivering energy (kilowatt-hours) but aren’t as good at delivering power (kilowatts). These new batteries seem to have fixed this problem, with power densities as good as the best supercapacitors with reasonable energy densities as well.
Energy storage devices are typically characterized using a Ragone Plot, which shows power density (in watts per kilogram) on the x-axis, and energy density (in watt-hours per kilogram) on the y-axis. Figure 3 from the article shows how these new batteries stack up.
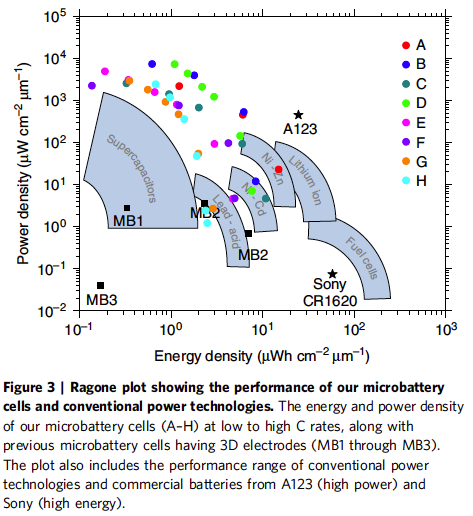
The new batteries are labeled A through H in the Figure, and they have high power densities (like super capacitors) and energy densities comparable in some cases to those of lead-acid, nickel cadmium, or nickel zinc batteries. The article makes the case that new ways of manufacturing batteries should allow us to overcome the power density limitations in typical batteries.
For real-world applications, of course, the issue will be whether these new batteries can be manufactured at competitive costs, but the article offers the hope that new ways of structuring battery materials can lead to substantial improvements in these devices. For those of us exploring the potential effects of widespread use of ultra-low-power electronics, that’s an exciting development.
The Associated Press reported that the European Union failed today to fix their emissions trading system. The price of emissions allowances has fallen to about 5 euros ($6.5 US) per ton of carbon dioxide, which is about one quarter of the value that has prevailed over most of the system’s history. The price dropped because the politicians, in their wisdom, allocated too many allowances in an effort to buy off the various status quo interests who would be affected by the system.
Such shenanigans are another argument for a simple carbon tax, collected at the top end of the market for fossil fuels, i.e. on the producers of fossil fuels. A carbon tax is much simpler and cheaper to administer and enforce. If you’re going to use emissions trading, at least understand that you need to crank down on the allowable emissions over time, to track the emissions reductions that will be needed to preserve a livable climate.
LBNL just released a report titled “The Impact of City-level Permitting Processes on Residential Photovoltaic Installation Prices and Development Times: An Empirical Analysis of Solar Systems in California Cities.” Here’s summary text from an email I just received from one of the study’s coauthors (Ryan Wiser):
Business process or “soft” costs account for well over 50% of the installed price of residential photovoltaic (PV) systems in the United States, so understanding these costs is crucial for identifying PV cost-reduction opportunities. Among these costs are those imposed by city-level permitting processes, which may add both expense and time to the residential PV development process.
Building on previous research, this study evaluates the effect of city-level permitting processes on the installed price of residential PV systems and on the time required to develop and install those systems. The study uses a unique data-set from the U.S. Department of Energy’s Rooftop Solar Challenge Program, which includes city-level permitting process “scores,” plus data from the California Solar Initiative and the U.S. Census. Using multivariate statistical analysis, the study quantifies the price and development-time effects of city-level permitting processes on more than 3,000 PV installations across 44 California cities in 2011.
Results indicate that city-level permitting processes have a substantial effect on average PV installation prices and project development times.
Overall, these findings illustrate the potential price and development-time benefits of streamlining local permitting procedures for PV systems.
The study’s final report can be found at:
http://emp.lbl.gov/sites/all/files/lbnl-6140e.pdf
A PowerPoint briefing that summarizes the report can be found at:
http://emp.lbl.gov/sites/all/files/lbnl-6140e-ppt_0.pdf
The bottom line is that permitting matters, and that cities who pay attention to fixing these processes can have a large impact on the costs their residents pay for installing solar photovoltaics. For those cities who want to go “whole hog”, they can copy the efforts of Lancaster, CA, which are about as aggressive as any I’ve seen.
Joe Romm of Climate Progress did a great service for climate communications on March 8th, 2013 by publishing this graph of historical and projected global temperatures:

Figure 1: Historical and projected global average surface temperatures on our current trajectory for fossil fuel emissions
The historical data in the graph came from a recently published article in Science, and the projected data came from the “no-policy” case developed by the folks at MIT back in 2009. The MIT case showed about a 5 Celsius degree increase in global average surface temperatures by 2100, equivalent to about a 9 Fahrenheit degree increase.
I like this graph because it combines what we know about historical temperatures with what is our most likely future–one where we continue to consume fossil fuels at increasing rates. I realized after seeing Joe’s graph that I could easily add additional context to it, because I have both historical data on carbon dioxide concentrations in the atmosphere, as well as the detailed projections from the MIT researchers (which I obtained from them while working on my most recent book, Cold Cash, Cool Climate: Science-based Advice for Ecological Entrepreneurs).
Here’s Figure 2-3 from Cold Cash, Cool Climate, updated to include CO2 concentrations through 2012. It shows historical carbon dioxide concentrations for the past 450,000 years, including the strikingly rapid increase since the 1800s. The early historical data come from the Vostok and Lawdome ice cores, while the more recent data (post 1959) come from direct measurements. We’ve pushed carbon dioxide concentrations well outside the range that has prevailed over the past 450 millennia.
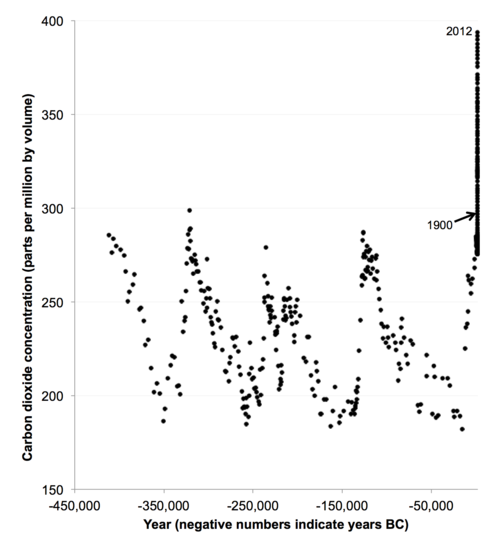
Figure 2: Carbon dioxide concentrations for the past 450,000 years
The data for the past 12,000 years, the period over which human civilization developed, shows a picture similar to Romm’s graph of temperatures. Carbon dioxide concentrations were relatively stable for the entirety of this period, slightly increasing over time, with the most rapid increase only happening as the industrial revolution accelerated in the 1800s.
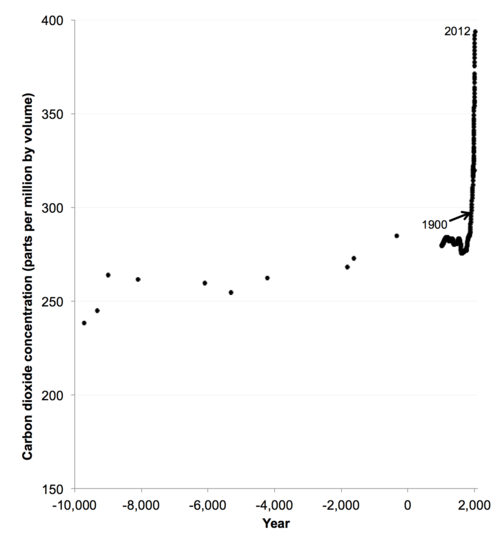
Figure 3: Carbon dioxide concentrations for the past 12,000 years
Of course, carbon dioxide concentrations are not the only determinant of global surface temperatures, so the concentrations graph won’t exactly match Romm’s temperature graph, but the fact that concentrations didn’t change much over 10,000 years is consistent with that graph.
The issue of most concern to people thinking sensibly about climate is not the historical change in carbon dioxide concentrations, but the likely trajectory of those concentrations if we continue on the path we’re on now. I’ve modified Figure 3 to include the MIT projections to 2100 to show just how big the change in carbon dioxide concentrations is likely to be (note that the y-axis in Figure 4 starts at 100 ppm, not 0 ppm). We’re on track for a threefold increase in the concentration of carbon dioxide by 2100 if our emissions proceed along the path expected by MIT’s no policy case.
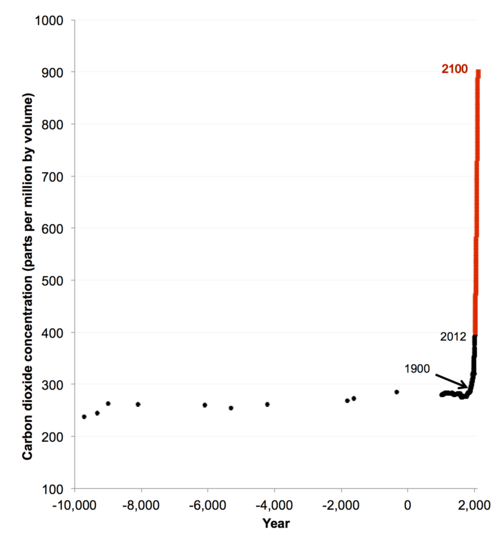
Figure 4: Carbon dioxide concentrations for the past 12,000 years and projected to 2100 assuming no change in policies
The picture is even more striking when compared to the past 450,000 years (Figure 5), showing that we’re moving the earth well out of the comfortable range in which humanity evolved and civilization developed.
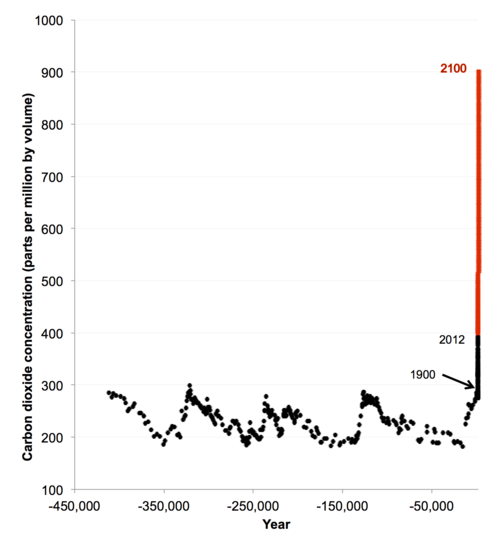
Figure 5: Carbon dioxide concentrations for the past 450,000 years and projected to 2100 assuming no change in policies
Of course, it’s not just carbon dioxide that matters. If you include the other important warming agents (like methane, nitrous oxides, CFCs and others) the MIT no policy case shows even bigger changes. Figure 6 modifies Figure 4 to include these other agents in the projection, expressed as carbon dioxide equivalent concentrations. Such conversions are complex and imperfect, but they’re good enough to get an order of magnitude estimate of the total potential impact of the path we’re now on.
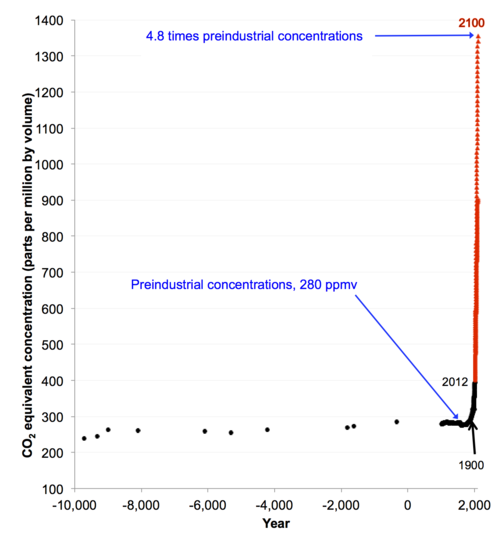
Figure 6: Carbon dioxide concentrations for the past 12,000 years and projected to 2100 assuming no change in policies, including other warming gases
Here’s the same graph going back 450,000 years (Figure 7).
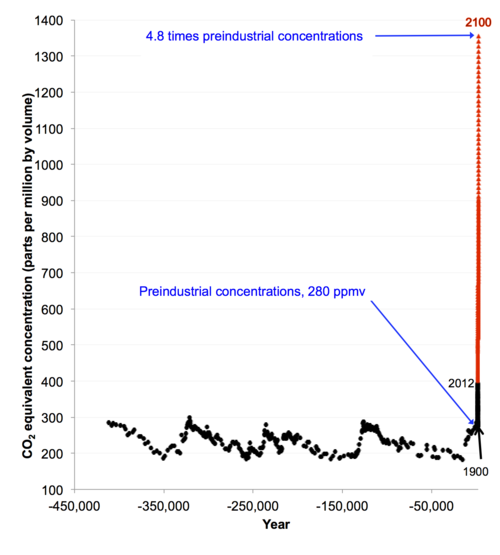
Figure 7: Carbon dioxide concentrations for the past 450,000 years and projected to 2100 assuming no change in policies, including other warming gases
The critical takeaway from Figures 6 and 7 is that we’re on track for more than two doublings of greenhouse gas concentrations by 2100 if we continue on our current path (greenhouse gas equivalent concentrations rise by a factor of 4.8 by 2100). Many in the media and elsewhere mistakenly focus only on the climate sensitivity, which is the expected increase in global average surface temperatures for a doubling of greenhouse gas equivalent concentrations (best estimate now is about 3 Celsius degrees, or 5.4 Fahrenheit degrees, per doubling). But it’s not just the temperature increase from a doubling of concentrations that matters, you also need to know how many doublings we’re in for!
I’ve been frustrated for many years by the way numbers about projected greenhouse gas concentrations have been presented, even by some folks who ought to know better. The most common approach has been to focus just on carbon dioxide, and make some hand-waving statements about the effects of the other warming agents, but that never satisfied me. As a comparison of Figure 4 and Figure 6 show, the other warming agents are significant contributors to warming, increasing the effective greenhouse gas concentration from about 900 ppm (for carbon dioxide alone) to about 1350 ppm when all warming agents are included.
The MIT researchers deserve great credit for their work. They appropriately defined a “no-policy” case to clearly show the effect of the current path we’re on (avoiding the confusion among policy makers engendered by the “multiple baselines” approach embodied in the IPCC Fourth Assessment report). They also conducted a comprehensive analysis of all warming agents, and made their data available to other researchers who could summarize the results in effective ways. It was quite a relief to discover their work, and it made writing the first few chapters of Cold Cash, Cool Climate a lot easier.
The last part of the puzzle is to understand whether the MIT no-policy case is a plausible representation of a world in which we initiate no constraints on greenhouse gas emissions. One way to do that is to compare the history for various drivers of emissions (like population, energy efficiency, and economic growth) to the projections, a task that I undertook in Chapter 2 of Cold Cash, Cool Climate. In virtually every case, the projected trends looked a lot like the previous 50 years, and in some cases, the projections showed more modest growth than one might expect from recent history.
Another way to assess the projection is to examine just how many fossil fuel resources exist, to see if it’s plausible that the world could burn the amount of fossil fuels embodied in the MIT no policy case. I conducted this exercise in Chapter 2 and Appendix A of Cold Cash, Cool Climate. I also summarized the results in my blog post titled “Why fossil fuel abundance is an illusion” (see Figure 8).
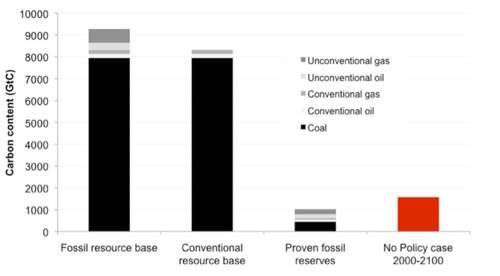
Figure 8: Lower bound estimates of fossil fuel reserves compared to fossil carbon emissions in the MIT’s no-policy case
The key conclusion from this analysis (which is based on lower-bound resource estimates taken from the most recent Global Energy Assessment) is that fossil fuel resource constraints are unlikely to constrain carbon emissions in the twenty first century. If we just burn the conventional oil and gas resource base plus the coal proven reserves, we’d only need to burn about 10% of the remaining coal in the “resource base” to hit the MIT no-policy case emissions by 2100. In a world where the true cost of fossil fuels is masked by subsidies and unpriced pollution costs, it is clear to me that we’d easily burn enough fossil fuels to match the no-policy case totals.
Conclusions
The case for concern about rising greenhouse gas (GHG) concentrations is ironclad, and the graphics above show one compelling way to describe that case. We’re on track for more than two doublings of greenhouse gas concentrations by 2100 when all warming agents are included. Combined with an expected warming of about 3 Celsius degrees per doubling of GHG concentrations (the climate sensitivity) that implies about a 6 Celsius degree warming commitment on our current path (the 5 Celsius degree warming calculated by MIT for 2100 is lower because it takes many centuries for the climate to equilibrate to fully account for the effects of changes in concentrations).
The graphs above show a dramatic shift in the climate system caused by human activity, one that has no precedent in human history. We need to leave more than three-quarters of proven fossil fuel reserves in the ground if we’re to stabilize the climate (for more technical backup on this point, see this classic paper by Meinshausen et al. and the technical details provided in Cold Cash, Cool Climate). It’s hard to imagine a starker challenge for humanity, but it’s one that we must confront if we’re to leave a livable world for our descendants.
In an article in a recent issue of Science, Diego Reforgiato Recupero discussed some aspects of reducing the environmental impact of the Internet, but muddled some key concepts, ignored others, and generally made a hash of things. It’s disappointing because those of us working on this issue for decades have tried at different points to publish much better articles on this topic in Science, to no avail. They also refused to publish a corrective letter that I and other colleagues at LBNL, Northwestern, and the University of South Florida wrote, so we posted it here (it may appear in shortened form as an online comment to the article, but the link gives the full letter with all citations).
Stay tuned for our article forthcoming in Nature Climate Change, which deals with the issues around reducing greenhouse gas emissions from data centers (one important part of the Internet) in a much more sensible way.
Recupero, Diego Reforgiato. 2013. “Toward a Green Internet." Science. vol. 339, no. 6127. March 29, 2013. pp. 1533-1534. [http://www.sciencemag.org/content/339/6127/1533.short]
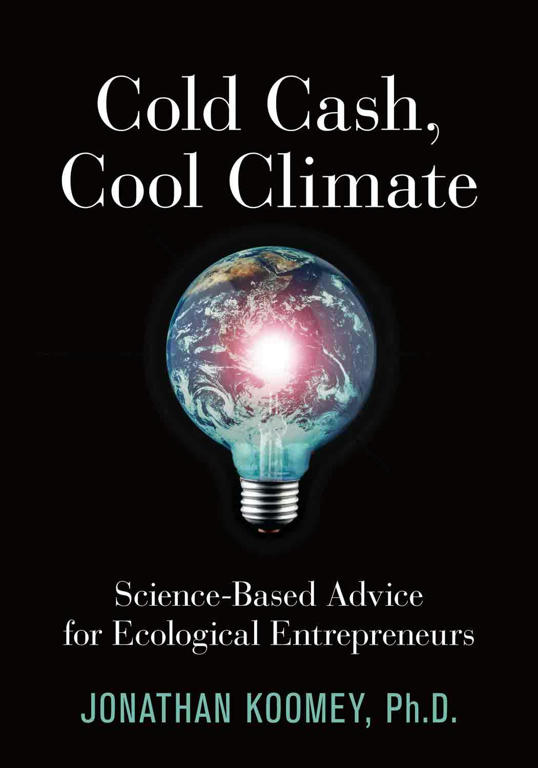
The web site Skeptical Science posted a review of my book Cold Cash, Cool Climate: Science-based Advice for Ecological Entrepreneurs yesterday. Here are the first few paragraphs:
Jonathan Koomey’s new book Cold Cash, Cool Climate: Science-Based Advice for Ecological Entrepreneurs puts forth an intriguing idea – entrepreneurs are one of the keys to meaningful, timely climate action. Society needs to make drastic changes to avoid dangerous global warming. However, institutions such as the government and big business only change slowly and incrementally, except under exceptional circumstances.
Koomey argues forcefully that it’s the very nature of entrepreneurs that make them an important part of the solution. While institutions often fear and resist change, entrepreneurs embrace it. The changes required are so large, no part of the economy will be untouched. Most people look at the enormity of this issue and despair. But entrepreneurs are famously scornful of the phrase “it can’t be done” and see opportunity.
This is not to say entrepreneurs are the magic bullet. One of the key points that Koomey makes is that we need to be addressing climate change on many fronts. The key to speeding up the change is to make the systems that are causing the climate problem obsolete more quickly. What entrepreneurs do is develop replacements that are so much better than to existing ways of doing things that people are willing to “upgrade” to gain the advantages of the new technology.
To read more, go here.

Koomey researches, writes, and lectures about climate solutions, critical thinking skills, and the environmental effects of information technology.