The New York Times just had an article about how insiders in the natural gas industry are concerned that the reserve and production estimates for recent shale gas discoveries have been significantly overestimated. The article states
“Money is pouring in” from investors even though shale gas is “inherently unprofitable,” an analyst from PNC Wealth Management, an investment company, wrote to a contractor in a February e-mail. “Reminds you of dot-coms.”
That development in itself is interesting, because the speculation in the industry in the past couple of years is that shale gas made available through fracking would enable a new era of cheap and abundant natural gas for the US. Some of that speculation is turning out to be hype, although there’s likely some truth in it also.
These developments point to a deeper issue, however: that of corporate governance and the government’s role in preserving the integrity of the market system. Two days ago, the New York Times reported that the SEC changed the reporting rules a few years ago so that natural gas companies drilling for shale gas could be more aggressive in how they booked reserves. As the article states
“In 2008, the stocks of many natural gas companies were sinking because of the financial meltdown, recession fears and falling gas prices.
But they began to rebound after a sweeping rule change by the Securities and Exchange Commission, intended to modernize how energy companies report their gas reserves.
As part of that change, the commission acquiesced to industry pressure by giving these companies greater latitude in how they estimated reserves in areas that were not yet drilled. The new rules, which were several years in the making, were officially adopted only weeks before the S.E.C. chairman under President George W. Bush, Christopher Cox, stepped down.”
The importance of this rule change cannot be overstated. Estimating the size of projected reserves is hard even with well understood technology. Doing it with a new technology like fracking is much more difficult. Erring on the high side (as the SEC appears to have done in this case) can create bubbles and hurt investors. Erring on the low side would make it harder for the companies to get capital, hurting investors in those companies and perhaps restricting the rate at which promising reserves could be tapped.
I think there’s a good argument for being conservative in such situations (i.e., erring on the low side): eventually reality will intervene, and if reserves are artificially overstated, then the correction, when it comes, will be sharp and painful. On the other hand, if reserves are understated, eventually it will become clear that the proven reserves are higher than initially expected, and that adjustment can be made with fuller knowledge. The investors in those reserves would be duly rewarded for their foresight.
Finally, this example shows the importance of having a functioning government regulatory system. Markets are human constructs and they can be made and operated well or poorly (for examples, see the terrific book McMillan, John. 2003. Reinventing the Bazaar: A Natural History of Markets. New York, NY: W.W. Norton & Company. ). If the regulators create rules not based on reality to favor certain industries, then disaster will eventually ensue, but the disaster doesn’t just hurt the company making the decisions, it also hurts investors who are misled by the incorrect claims of high reserves. That’s why the public interest demands regulation of markets so that the investing public has full and accurate knowledge about the claims companies make (that’s true also for consumer and food safety, as well as environmental issues).
The rules about such reporting play a critical role in ensuring accurate information, and they should be as reality based as we can make them. Too often that has not been the case. It’s true for the specific example of shale gas, but it’s also clearly true for financial markets, as Adam Smith pointed out more than 200 years ago. Having weak, ineffective, and feckless regulation hurts the market, and sensible folks ought to fight for reality-based regulation. Markets can’t survive long without it.
An article in today’s New York Times discusses the “safety myth” promoted by Japan’s nuclear industry and the effect of that myth on the country’s ability to respond to the Fukushima accidents when they occurred. It’s a fascinating cautionary tale of what can happen when fallible humans interact with unforgiving technology. And it shows how people and institutions create myths about technology that can lead to unintended consequences. Finally, it illustrates that technology and culture interact in complex and unpredictable ways (a lesson that is not a surprise to those who study the history of technology, but it’s a fact not as widely accepted in the hard-core technical community). All in all, a great read for students of these issues.
It’s often stated that the Three Mile Island (TMI) accident in 1979 was the main cause of the demise of nuclear power in the United States. This line of argument posits that the safety regulations promulgated after TMI (along with associated legal wrangling) increased reactor costs and construction times so much that the industry could no longer compete. This argument has arisen anew in the aftermath of the nuclear meltdowns at Fukushima, in which people have been quick to draw parallels to TMI. In particular, some argue that the industry would have expanded in the 1980s were it not for the regulatory response after TMI, and caution against such a response again.
For example, a 2006 New York Times Magazine article stated “The received wisdom about the United States nuclear industry is that it began a long and inexorable decline immediately after the near meltdown, in 1979, at Three Mile Island in central Pennsylvania, an accident that — in one of those rare alignments of Hollywood fantasy and real-world events — was preceded by the release of the film “The China Syndrome” two weeks earlier.” The article then goes on to explain that the real story is more complicated than that, but the “received wisdom” still seems to be widely accepted.
“In the 1970s it looked as if nuclear power was going to play a much bigger role than eventually turned out to be the case. What happened was Three Mile Island, and the birth of an anti-nuclear movement that stopped dozens of half-built or proposed reactors…”
The op-ed contained some errors, laid out in a post by Joe Romm on Climate Progress (the errors about the area taken up by wind turbines and the area of Japan were fixed with a corrective note that is included in the current version of the op-ed). The important point for our purposes is that Lynas and others who make this argument are attempting to blame TMI and the anti-nuclear movement (which started well before TMI, it should be noted) for being the main factors stopping nuclear power plants either proposed or under construction. But the story is not nearly as simple as that.
What does this argument really mean?
Let’s begin by examining the argument itself so we are clear on the claim we’re evaluating. The complaint is that regulations after TMI unfairly burdened the industry, leading to increasing costs, longer construction times, and comparative economics that made it impossible for nuclear plants to compete with other sources of electricity. The emphasis on the unfairness of these regulations conveys the idea that somehow the regulators (prompted, it is implied, by the anti-nuclear movement) went too far after TMI, and that caused most of the industry’s problems.
In evaluating this claim it is worth keeping several factors in mind:
1) We will probably never know for sure exactly how much blame to assign TMI vs. other factors, because such historical events are usually so complex as to defy precise attribution after the fact.
2) It may be true that safety regulations following TMI did cause costs to increase and completion times to lengthen for plants under construction at the time. It may also be true that the regulators went overboard in some cases. What is certain, however, is that some increased regulatory stringency was justified after TMI, which was arguably the worst reactor accident the US had ever experienced. These regulations could therefore be seen as a justifiable expense, to the extent that the creation and enforcement of those regulations was not an overreaction to the accident.
3) TMI may also have made it impossible for the industry to ignore earlier regulations, or that enforcement of existing regulations became more stringent after TMI (this hypothesis came to us from Mark Cooper at Vermont Law School). It’s hard to argue against improved enforcement of existing regulations but if enforcement were overzealous or capricious, it could have had negative effects on the industry that were not justified by real safety risks. On the other hand, stricter enforcement may also fall into the category of real costs inherent to making the technology safe that had not fully been incorporated before TMI.
4) It is important to distinguish the effect of TMI (and the associated regulatory response) on plants that were already under construction in 1979 from its effect on potential future reactor orders. It is plausible that the regulations promulgated after TMI would have had some effect on reactors “in the pipeline”, but it’s far less clear that the absence of TMI would have helped the industry overcome the other factors that we discuss below somehow leading to new reactor orders after 1979, given the other big challenges the industry faced.
5) Other countries (like France, Germany, and the UK) faced cost escalation and plant delays without having reactor accidents comparable to TMI, so clearly other things were going on with the economics of reactors than just the response to TMI. See reference 10, Arnulf Grubler’s Energy Policy article on France, and Joe Romm’s blog post on French reactor costs for more details.
What do the data show?
To shed some light on this question, we revisited our data (see references, 4, 5, 6 and 8 below) and combined it with other data sources to determine what they could tell us about the effect of TMI on the US nuclear industry. In particular, we examined the history of US reactors, focusing on the year of project initiation (measured here as the approval of a construction permit), the year of project completion or cancellation, and the year of reactor shutdown (where applicable). It is clear from our review that TMI caused changes in safety regulations that increased costs (to some degree) and delayed construction of some plants that were already under construction (to some degree); however, it’s wise not to read too much into the importance of TMI. Even before the accident, nuclear plant costs were already rising rapidly and completion rates slowing (see references 1, 7, and 8), and while TMI might have accelerated these trends somewhat, they were already well underway by 1979. New reactor orders had slowed to a tiny trickle before TMI and the last US reactor order was in 1978 according to the Nuclear Energy Institute. All reactors ordered after 1973 were subsequently cancelled.
One historical example in support of these conclusions is reference 1 (Bupp and Derian 1981). This book, which is widely regarded as one of the most authoritative sources on the history of US nuclear power, was originally published in 1978 with the title: Light Water: How the Nuclear Dream Dissolved, indicating that many of the problems of the industry preceded TMI (we’re indebted to Peter Bradford for this insight).
The difference between the date of project initiation and project completion gives the construction duration for the reactor, which is one of the most important parameters affecting reactor costs. We used our database from reference 8 combined with two sources for cancellations, NRC and Clone Master. We cross checked the cancellation databases against each other to make sure they agreed, and when they disagreed we used the NRC data (the Clone Master data was in a more convenient form).
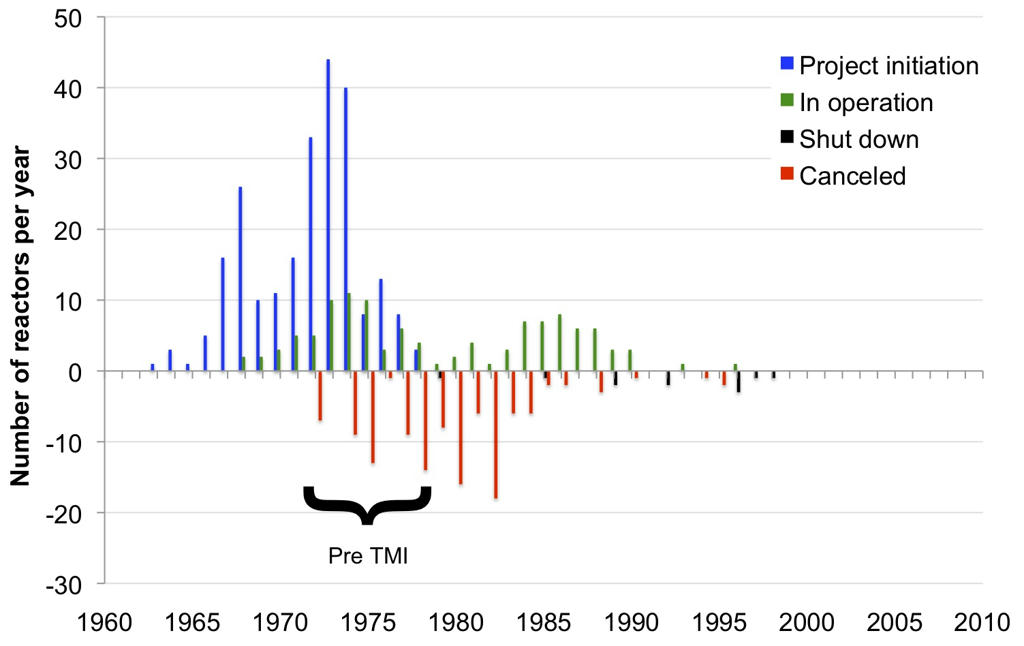
Figure 1 shows the annual history of reactor construction starts, completions, cancellations, and shut downs. No reactors were granted construction permits after 1979. It also shows that there were many cancellations of reactors before 1979. Finally, the bimodal nature of reactor completions suggests that construction slowed down around 1980, with completions picking up again in the mid 1980s.
Figure 1: US nuclear construction starts, completions, cancellations and shut downs by year (Copyright Jonathan Koomey 2011)
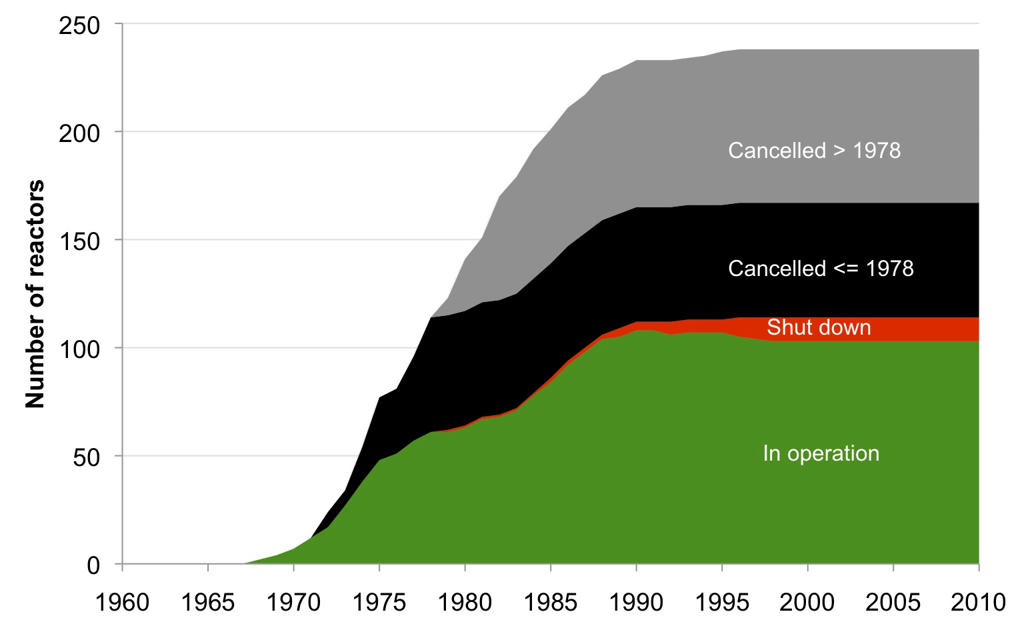
Figure 2 shows the annual data plotted cumulatively, which shows that more than half of all reactors ordered were subsequently cancelled. About 40% of all cancelled reactors were cancelled before 1979, and these can’t be attributed to TMI. That means that cost escalation and other forces afflicting the nuclear industry were well underway before TMI.
Figure 2: Cumulative US nuclear construction starts, completions, cancellations and shut downs (Copyright Jonathan Koomey 2011)
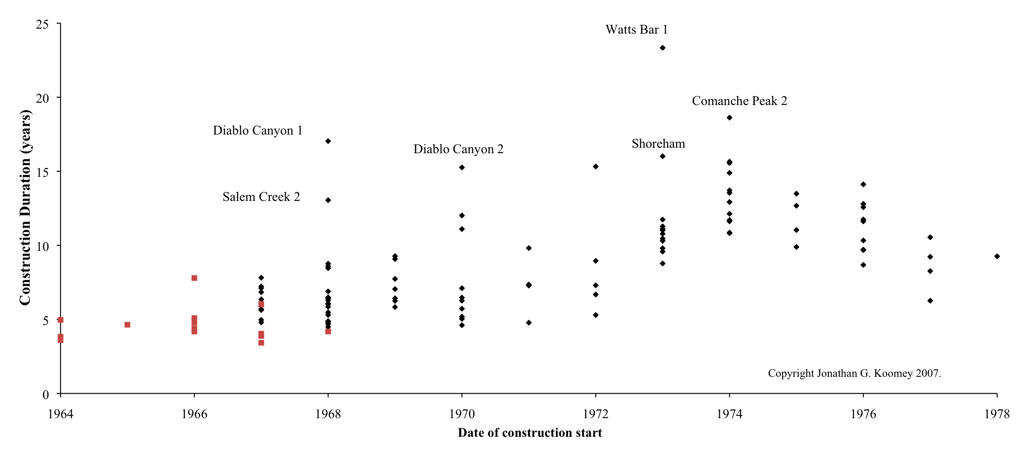
Now consider Figure 3, which shows construction duration as a function of construction start date (reactors in red were those early reactors for which we didn’t have cost data but for which we had construction duration data). The graph shows that the minimum construction duration for plants begun between 1966 and 1972 bounced around a bit but remained around 5 years, but it began to rise substantially for plants begun in 1973. It peaked in 1974, then declined again. These data are suggestive, but not conclusive. It is possible that plants begun in 1973 and 1974 were just far enough along in their construction process in 1979-80 for the changes in regulations from TMI (as well as the other factors discussed below) to have a significant effect on their construction duration. Plants started later were not as far along in construction in 1980 and were presumably easier to modify to reflect regulatory and other changes.
Figure 3: US reactor construction duration as a function of date of construction start (Copyright Jonathan Koomey 2011)
Chapter 6 of Charles Komanoff’s classic book Power Plant Cost Escalation (reference 7, which can be downloaded here) describes in great detail the character and scope of the changes in safety regulations that were likely to be the result of TMI. This chapter was written (according to Komanoff) in 1979-80, and his predictions were largely borne out. The changes were indeed substantial and there’s no doubt they affected the way reactors were constructed in the US. What is not clear is exactly how important these regulatory changes were compared to the other factors affecting the electric power industry at the same time. Komanoff gave his own list of 10 important factors here. Our own assessment of the most important factors combines some of Komanoff’s categories and include three additional factors–declining electricity demand growth, structural problems in the industry, and the rise of non-utility generation:
1) Declining demand growth for electricity, culminating in overcapacity in the early 1980s.
2) High interest rates
3) Structural problems in the industry
4) Changing public perceptions of the credibility of the nuclear industry.
5) The rise of the independent power industry in the US combined with restructuring and integrated resource planning.
Let's examine each of these in turn.
1) Electricity demand growth: We plotted the annual rate of change in electricity consumption from 1949 to 2009 using EIA Annual Energy Review data (see Figure 4). We also plotted a lagging 5 year average starting in 1954 (for the few years before that we averaged the years we had, starting with the 1st year, then averaging years 1 and 2, then years 1,2, and 3, then years 1, 2, 3, 4). While there are more sophisticated ways to analyze trends, this simple approach is both easy to explain and also illustrative of the kind of analysis typical utility analysts would have conducted of those trends in the 1970s and 80s.
Figure 4: US electricity consumption growth over time (Copyright Jonathan Koomey 2011)
From around 1960 until the early 1970s electricity demand was growing steadily and rapidly at about 7% per year. The 1973 and 1979 oil shocks reduced demand growth to around 3% per year from the late 1970s until the early 1990s, and the volatility of demand from year to year increased a great deal. From the early 1990s through 2008 electricity demand growth declined from around 2.5%/year to around 1% per year, and then absolute demand dropped significantly in 2009 as a result of the global economic crisis.
An environment of declining electricity demand growth accompanied by increased volatility is a difficult one for long lead-time capital-intensive projects like nuclear plants, as NRC Commissioner Victor Gilinsky argued in January 1980 (reference 2). The construction of such plants is predicated on sufficient and reliable demand growth, and when growth slows, the economic justification for such plants deteriorates rapidly. We (and Commissioner Gilinsky) believe this factor was one of the most important ones that led to longer lead times and higher construction costs. Further analysis is needed to see just how important it was, and a state by state regression analysis that correlated construction lead times with state level electricity growth data would probably yield insights.
The end result of declining demand growth and the utility construction boom of the 1970s was overcapacity in the early 1980s (many utilities argued that high demand growth would return, so they kept building plants). The EEI Statistical Yearbook of the Electric Utility Industry gives data on capacity margins (defined as the difference between installed capacity and peak demand divided by installed capacity). The term reserve margin is actually a more common term and it is defined similarly (reserve margin is the difference between installed capacity and peak demand divided by peak demand).
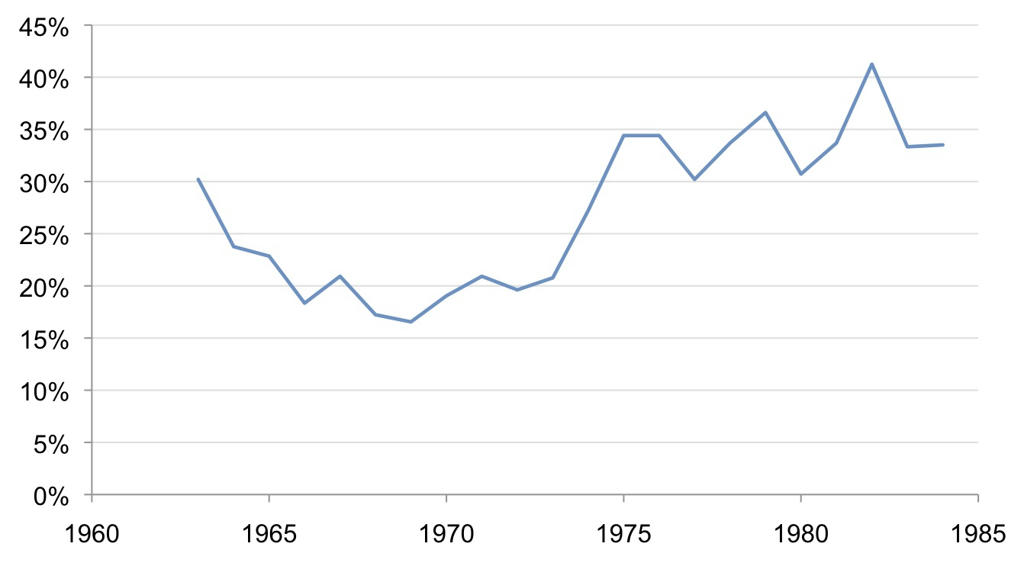
Figure 5 shows reserve margins calculated from the EEI capacity margin data for 1963 through 1984 (we’re working on getting the EEI data for later years). Utilities typically target reserve margins of 15-20% to preserve reliability, and they did so successfully from 1966 through 1973. Things changed in 1974, when reserve margin jumped to 27% in 1974 and 35% in 1975, and stayed between 30% and 41% through 1984. These data indicate overcapacity on a large scale. To truly understand the importance of this factor would require state-by-state or regional analysis, but the overcapacity in the early 1980s was large enough at the national level to suggest that it probably affected utility decisions about the rate of construction progress on nuclear plants under construction.
Figure 5: US electric utility reserve margins 1963-1984 (Copyright Jonathan Koomey 2011)
For a fascinating contemporaneous account of the important effects of declining demand growth on the decision making of utilities in Illinois circa 1980, go here. That account, by the journalist William Lambrecht, stated:
“The Three Mile Island nuclear accident near Harrisburg, Pa., shook public perception of nuclear power, while resulting in new safeguards required by the Nuclear Regulatory Commission. But it apparently contributed less to the industry slowdown than is commonly believed, and substantially less than the simple effects of supply and demand. In the late 1960’s and early 1970’s, when many utilities drew expansion plans of grandiose proportions, the average estimated load growth rate around the country was 7 percent annually.”
“However, the 1973 oil embargo by Arab nations set in motion a chain of events that would markedly alter patterns of energy consumption. In the words of Scott Peters of the Atomic Industrial Forum, ‘Utilities suddenly found that they were overcommitted, and their load growth projections had to be tossed in the wastebasket.’ ”
Soon after TMI it was clear to some observers (like Gilinsky and Lambrecht) that overcapacity caused in part by lower demand growth led some utilities to slow down construction of reactors in the pipeline. It also had a chilling effect on the market for new reactors.
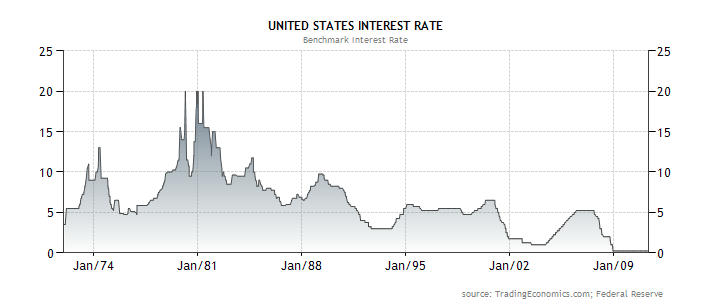
2) Interest rates peaked at around 20% in the 1979 to 1981 period, according to the site Tradingeconomics (see the site Economagic for a time series of the US prime rate, which also peaks at 20% in 1980-81). While it’s not clear exactly which interest rates TradingEconomics used as the proxy for US rates, the graph from that site (Figure 6) is striking, and the message unmistakeable: at the same time as TMI occurred, interest rates were at unprecedented levels. That had to weigh heavily on the financing and cash flows of an industry constructing capital-intensive power plants, and this had absolutely nothing to do with TMI.
Figure 6: Nominal US interest rates over time
3) Structural problems in the industry: in the late 1960s and early 1970s, the industry rushed to build plants before sufficient experience had been gained with the earlier generation of reactors, with the assumption that economies of unit scale would continue to accrue without corresponding diseconomies (references 1 and 3 show that this assumption turned out not to be correct). At the same time, many reactors started construction with as little as 10% of their design completed, which made them even more subject to cost escalation than they would otherwise have been (see reference 8 for some discussion on this point).
4) Changing perceptions of the nuclear industry: TMI represented a pivotal event that made the public think twice about supporting nuclear power, in large part because the nuclear industry had assured us that such an accident couldn’t happen here. There were other such events that had a similar effect (See Komanoff's “10 blows” article for more details): those included a fire at Brown’s Ferry in 1975, three former GE nuclear engineers who joined antinuclear organizations, and the reversal of pipes at the Diablo Canyon reactors in 1981 that “virtually [disabled] their seismic protection systems”. These events, combined with TMI, served to undermine the credibility of the nuclear industry in a way that had lasting effects (and these effects were distinct from the effect of the new safety regulations imposed by the NRC after TMI).
5) The rise of the US independent power industry and the increasing prevalence of restructuring/deregulation: In one of the great success stories of new technology development in the past few decades, the independent power industry arose from humble origins to dominate the supply of new electric generation capacity in the US. As Peter Bradford argued in a Wall Street Journal Book Review, “Nuclear-plant construction in this country came to a halt because a law passed in 1978 [PURPA] created competitive markets for power. These markets required investors rather than utility customers to assume the risk of cost overruns, plant cancellations and poor operation. Today, private investors still shun the risks of building new reactors in all nations that employ power markets.”
This shift of expectations about who was responsible for funding the development of new supply resources coincided with the rise of what’s called “Integrated Resource Planning” (IRP) or “Least Cost Planning” (LCP), which encouraged utilities to do a least-cost integration of all resources, including energy efficiency. The conceptual foundations of this approach were fully fleshed out by the late 1980s (see reference 9). The net result of this new approach was to bring previously ignored utility resources (like independent power generation and energy efficiency) into the mainstream, and made it possible for utilities to avoid building new capacity using standard financing methods.
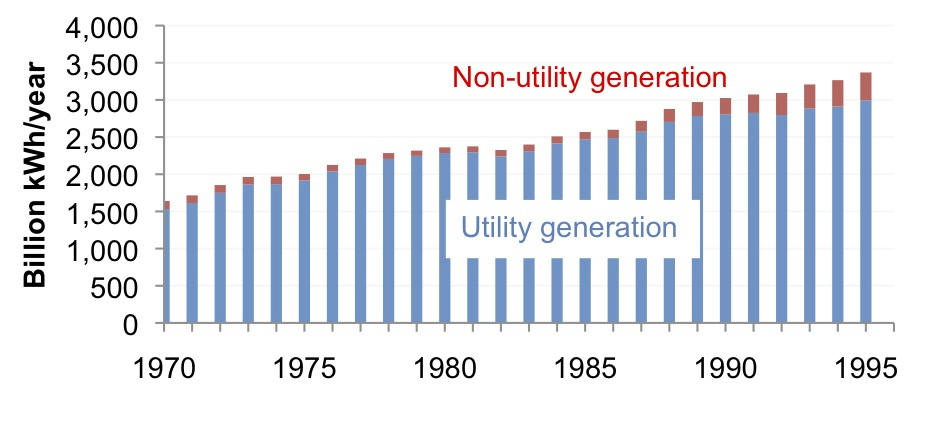
As one example of the effect of those changes, see Figure 7 below. This figure shows utility and non-utility generation over time from US EIA data. Non-utility generation dropped from 108 BkWh/year in 1970 to 71 BkWh/year in 1979. It began to rise after 1979 and by 1995 it had reached almost 400 BkWh/year, which is the equivalent of 133 typical 500 MW coal plants. This graph is a testament to the effects of the changes in utility resource acquisition practices that came into use after the passage of the Public Utility Regulatory Policies Act of 1978 (PURPA).
Figure 7: US utility and non-utility net generation 1970 to 1996 (billion kWh/year, Copyright Jonathan Koomey, 2011)
The nuclear industry faced big challenges even before TMI: of all reactors cancelled, 40% of were abandoned before 1979. The interlinked issues of declining demand growth, high interest rates, nuclear industry structural problems, changing public perceptions, and the rise of alternative means of acquiring utility resources all had powerful effects on the viability of the nuclear enterprise. It is therefore not correct to conclude that the Three Mile Island accident was the sole or even the most important factor leading to the difficulties the US industry has faced. The accident clearly had some effect on reactors then under construction, but we are convinced that the other factors we list above were in the aggregate more important than TMI in their effect on the likelihood of new nuclear orders in the post-TMI period.
–Jonathan Koomey and Nate Hultman
Acknowledgements
This post benefited greatly from discussions with Peter Bradford, Ralph Cavanagh, Mark Cooper, Victor Gilinsky, Jim Harding, Charles Komanoff, Amory Lovins, and Joe Romm. We’d also like to thank Gregory Carlock, who helped us with data collection and analysis.
References
1. Bupp, Irvin C., and Jean-Claude Derian. 1981. The Failed Promise of Nuclear Power: The Story of Light Water. New York, NY: Basic Books, Inc.
5. Hultman, Nathan E., and Jonathan G. Koomey. 2007. “The risk of surprise in energy technology costs." Environmental Research Letters. vol. 2, no. 034002. July. <http://www.iop.org/EJ/abstract/1748-9326/2/3/034002/>
6. Hultman, Nathan E., Jonathan G. Koomey, and Daniel M. Kammen. 2007. "What history can teach us about the future costs of U.S. nuclear power." Environmental Science & Technology. vol. 41, no. 7. April 1. pp. 2088-2093.
8. Koomey, Jonathan G., and Nathan E. Hultman. 2007. "A reactor-level analysis of busbar costs for U.S. nuclear plants, 1970-2005." Energy Policy. vol. 35, no. 11. November. pp. 5630-5642. <http://dx.doi.org/10.1016/j.enpol.2007.06.005> (Subscription required).
9. Krause, Florentin, and Joseph Eto. 1988. Least-Cost Utility Planning: A Handbook for Public Utility Commissioners (v.2): The Demand Side: Conceptual and Methodological Issues. National Association of Regulatory Utility Commissioners, Washington, DC. December.
10. Krause, Florentin, Jonathan Koomey, David Olivier, Pierre Radanne, and Mycle Schneider. 1994. Nuclear Power: The Cost and Potential of Low-Carbon Resource Options in Western Europe. El Cerrito, CA: International Project for Sustainable Energy Paths. <http://www.mediafire.com/file/kjwo9gjwtj5p11t/nuclearpowerbook.pdf>
Gore’s article in Rolling Stone lays out what’s going on in the climate debate with exceptional clarity.
See also Joe Romm’s excellent commentary about how the media just ignore Gore’s criticisms of the media’s behavior, focusing on the Gore vs. Obama angle.
Gore’s article frames the current situation really well. It’s up to all of us to use this framing to fight back against the bad actors Naomi Oreskes has dubbed “The Merchants of Doubt”, who use the same dishonest arguments and techniques fighting climate action that they used against seat belts, air bags, DDT, cigarettes, efficiency standards for autos, lead in gasoline, asbestos–the list goes on and on. How many times are people going to keep falling for this act?
The New York Times today reports that airlines are exploring ways to reduce the amount of paper each plane carries as a way to reduce weight and fuel costs. The article implies that each pound of additional weight costs $17,600 (=$440,000/25 lbs) in added fuel costs over the course of a year, which I’m convinced is an overestimate. The statistic I recall from my work on Winning the Oil Endgame is each pound of additional weight costs 100 to 150 gallons of jet fuel each year for each aircraft, which is still enough to justify switching to electronic documents, but far less than what the article implies (even at $4/gallon of fuel!).
This is another nice example of how information technology allows us to substitute bits for atoms, thus allowing for substantial environmental improvements while also reducing the costs of goods and services. For more discussion of this and related issues, go here.
Rayner uses our work as backdrop to tell the story of five key technologies that will have a huge impact on environmental issues in coming years. Here’s his list:
I had heard of motion sensors controlling display cases before, but the Target in Emeryville, CA (which we visited this morning) has a particularly nice implementation of that technology. The display cases are lit with LEDs (see below).
And here’s a closer shot of the motion detector:
There were motion detectors every 8-10 feet along each row, and if you started walking down the aisle the lights inside the cases came one one by one. I suspect that motion sensors could be used with incandescent lights but the lifetimes of such bulbs are short enough to make an application like this less feasible than with LEDs, which typically last thirty times longer than incandescents. LED lifetime is also not affected by turning them on and off (see this Wikipedia article for more details).
It took a little more than a minute for the lamps to switch off when no motion was detected, at least for the aisle I visited. I’m not sure if delay times vary by aisle or food type.
James Kanter has a very nice article on NYTimes.com today on data centers and the search for ever better ways to cool those facilities. Typical “in-house” data centers nowadays devote one kWh of electricity to cooling, pumps, fans, and power systems for every kWh of electricity used for servers (for details, see the EPA Report to Congress on Data Centers). That additional kWh is “overhead”, and to the extent that it can be reduced, data centers can save big on both energy costs and capital costs to construct these facilities. The service we really care about is computing, and so eliminating the waste associated with cooling the computers is all gravy.
Cloud computing providers have made big progress on reducing this waste, reaching overhead levels of 0.1 to 0.2 kWh per kWh of IT electricity use. For example, Google documents the PUE for their data centers here, and they boast an average overhead of 0.16 kWh/kWh of IT usage averaged across nine facilities. Centralized computing providers can achieve such savings because they have at least four advantages over the “in-house” facilities, as I’ve explained frequently (for one example, go here):
1) Diversity
2) Economies of scale
3) Flexibility
4) Ease of enabling structural change
These advantages mean that there will be ever more compelling economic reasons to using centralized computing facilities over in-house IT with each passing year. There still are good reasons for certain kinds of computing to be done in-house, but the powerful advantages of centralized computing will continue to create economic pressure to move to the cloud for many applications.
“The Obama administration is leading a global effort to deploy “shadow” Internet and mobile phone systems that dissidents can use to undermine repressive governments that seek to silence them by censoring or shutting down telecommunications networks.
The effort includes secretive projects to create independent cellphone networks inside foreign countries, as well as one operation out of a spy novel in a fifth-floor shop on L Street in Washington, where a group of young entrepreneurs who look as if they could be in a garage band are fitting deceptively innocent-looking hardware into a prototype “Internet in a suitcase.””
This development is of course good news for people who believe in the free exchange of information, but it’s also a reminder of the power of the long-term trends in computing efficiency I’ve blogged on previously (here and here).
The research (which will be published this year in the IEEE Annals of the History of Computing) shows that computations per kWh (ie energy efficiency of computation) for all types of computers has doubled roughly every year and a half since Eniac in 1946.
The big implications of these trends are for mobile computing devices, the existence of which was an inevitable outcome of these trends. Doubling of computing efficiency every year and a half means a factor of 100 improvement every decade. That means that at a fixed level of computation the need for battery capacity will decrease at that rate every decade. Alternatively, you could have 20 times more computation at 5 times the battery life. And that progress implies ever greater use of mobile computing, sensors, and controls, which will allow us to better match services supplied with services demanded. It will also lead to an explosion of data the likes of which we haven’t yet experienced (we ain’t seen nothing yet!).
And it’s not right to call it “Moore’s law” (as some still do) because these trends PRECEDE Moore’s law (they hold true for tube and discrete transistor computers, not just microprocessors). In fact, they are an inherent feature of electronic information technology, as our paper shows.
The industry hasn’t fully absorbed the implications of these trends, but I think they are critically important to understanding its future. Internet in a suitcase is a nice result, but there are many other such innovations that will no doubt surprise us all in coming years.
On June 3, 2011, Climate Progress reported on the development of a new type of corporation, the B-corp, “which modifies governance so that managers respond to long-term interests of investors, stakeholders, and the environment, rather than just focusing on short-term profits.” This is an important development because it changes the "rules of the game", as B Lab co-founder Coen Gilbert explained in a Harvard Business School case study of his company.
Many people forget that the economy can’t exist without a government to define property rights, enforce contracts, charter corporations, regulate socially destructive corporate behavior, and determine the rules of the game. When government doesn’t take these responsibilities seriously enough we end up with lead in children’s toys, e coli in food, global financial crises, and rivers that catch on fire, and no one should find that to be a particularly good outcome.
I’m excited about this idea because it does what some of us have advocated for a long time: change the charter of corporations to redefine property rights, and add some responsibilities while we’re at it. Corporations are socially constructed entities and we get to choose how their governance and underlying incentives should be structured. By changing the assumptions behind their design it’s possible to set a new course for the economy, one where private profit can be more closely aligned with public good.
Of course, changing the charter for existing corporations would be difficult, but there may be other ways to accomplish the same goal for those institutions. In any case, creating a new type of corporation that deals explicitly with issues of standards, transparency, legal status, and incentives is a good first step, and I applaud the B Lab folks for starting down this path.
And this development is also a reminder that the innovations we’ll need to truly face the climate challenge are not just technical, though we’ll need plenty of those to get to the greenhouse gas emissions reductions that will be required to stabilize the climate. Social and institutional innovations will play an important role as well, given the rate, scale, and scope of changes that are required.
In an earlier post I speculated about window-integrated PV, and have now completed some further investigations.
I emailed with Richard Lunt, the lead researcher on the window integrated PV paper, as well as with my friend Steve Selkowitz, head of LBNL’s Windows and Daylighting Group, about this new innovation, and they agreed it would be OK for me to share some of their thoughts here.
Richard seems to be thinking along the same lines as I am (direct use of the electricity at the window as opposed to distributing it throughout the building). That means you get to cut out some of the balance of system costs for the PVs, which is typically half the installed cost for PV systems, as well as to avoid the costs of the glass and other structural elements that otherwise would contribute to the cost of the PV system.
He added a few more wrinkles:
1) the maximum theoretical efficiency for such cells is 22%, once you eliminate visible light from the solar spectrum. The new cells have efficiencies of just under 2% in their experiments, with the goal of getting to 10%.
2) large buildings in urban environments have very large vertical areas that will intercept significant amounts of solar radiation in the mornings and afternoons, and the IR component is more significant at these times because the scattering of light is more prevalent for the visible spectrum than for IR/UV.
3) a compensating factor is that “these organic solar cells have much better efficiencies at low illumination intensity than traditional inorganic semiconductors”.
It’s clear from his comments that he (wisely) isn’t expecting this to be a silver bullet, but one more solution that could be useful in particular circumstances.
And that brings me to the question of performance vs cost, which Steve Selkowitz brought up first thing. All of my speculations presume that the technology gets to a point where it is cost effective to apply it in the kinds of applications I propose. If that doesn’t happen, then the speculations are moot. But in this case, there are several other paths up the mountain, so the ideas I mention could make sense anyhow.
I visited Steve in his office on Friday, May 6, 2011 and I got an earful about the opportunities (large) and the complexities (significant). The key tradeoffs for electrochromics and window integrated PVs relate to the comparative value of lighting, cooling and power. An electrochromic window in conjunction with dimmable lighting can be a big lighting energy saver (the largest commercial building end use) but its value will be reduced if a significant fraction of the visible sunlight is converted to electric power at the window. Selkowitz points out that daylighting a room with an electrochromic window or skylight uses solar energy at 3 – 10 times the efficiency of the sunlight-to-PV-electricity-to-electric lighting pathway.
There are a few other issues the manufacturers are working out as well. For example the time it takes for some electrochromic technologies to switch between transparent and opaque is an issue that I hadn’t considered (some switch very rapidly, others take seconds to minutes). And some electrochromics may require application of a very small constant voltage to maintain their optical state, while others are more like a flip-flop (the electronic kind, not the beachware kind) in that once they reach a state they stay there without additional effort or electricity. Finally, there are new thermochromic glazings that respond to temperature instead of voltage, which is a whole different kettle of fish.
He also pointed out a few other issues with my earlier post:
1) Self powered skylight shades already exist. Velux has a skylight with a motorized shade that uses ordinary PVs on the frame of the shade to power itself (I haven’t found this online yet but will post a link here when I do). In any case, such installations need batteries in case you want the skylight to operate at night, but this cost can be offset by not having to run wires to the skylight.
2) For cars, ventilation is a good thing, but it’s a complex design space because you’ll also want aggressive use of UV/IR blocking coatings that would need to be applied in addition to the PV coating, and the details of how to do that in practice haven’t been fully worked out yet as cost effective solutions.
3) The expected lifetime of these coatings as well as efficiency degradation over time are both real issues that the technology folks are addressing.
4) Finally, electrochromic glazings now retail for roughly an additional $50/sf, and adding another expensive layer to such windows is going to raise costs further and make rapid penetration that much more difficult.
Selkowitz’s team at LBNL has been developing and promoting electrochromic windows for over 20 years and he thinks he can now see the daylight at the end of the electrochromic tunnel. But he thinks the early markets will do better focusing on the electrochromic elements alone, adding PV later once both technologies are better established.
Bottom line, if we can make window integrated PVs with low cost, high reliability, and long lifetime, there will be niches where they will be important. I’ll post more as I learn more.
We visited Bill Nye’s terrific Climate Lab at the Chabot Space and Science Center in Oakland, CA on Saturday May 7, 2011. I didn’t get to play around with the exhibits as much as I’d like (that’s what happens when you have two year old twins) but I was very impressed with the smart use of new media and the ways the exhibit got kids to participate. The focus was mostly on solutions to the climate problem, which was a refreshing change, and the technical information it provided was almost all on the mark. I heartily recommend this exhibit for those in the Bay area who are interested. It’s a very nice way to educate kids about climate.
I’ve provided some photos below. The light level in the exhibit is much brighter than the photos indicate.
Andrew Fanara, Larry Vertal, and me at the Uptime Institute Symposium in Santa Clara, CA, May 11, 2011. The three of us were at the center of efforts to improve energy efficiency in servers and data centers starting in early 2006. Larry was at AMD when that company started to use efficiency as a selling point for their processors in servers (he also funded my papers on electricity used by servers that came out in 2007 and that grew into the analysis for the EPA Report to Congress and this 2008 peer reviewed journal article). Andrew was at EPA’s Energy Star Program (he initiated and sponsored the two meetings on data center efficiency I chaired in 2006—for more details go here).
Today Intel announced the commercialization of 3D transistors using low voltages and a 22 nm fab process, a development that will help the technology industry keep pace with the long term trends in power efficiency identified in our forthcoming IEEE article (Koomey, Jonathan G., Stephen Berard, Marla Sanchez, and Henry Wong. 2010. “Implications of Historical Trends in The Electrical Efficiency of Computing." In Press at the IEEE Annals of the History of Computing. March.) . These new chips should deliver the same performance as 2D chips using half the power, and that’s good news for the continued development and proliferation of wireless sensors, controls, and mobile data analysis devices.
People have been predicting the end of Moore’s law for a long time. Over the years, my friends at Intel would only guarantee that they could keep up with those trends for the next five or ten years, but then they weren’t sure. The important thing is that they keep pulling rabbits out of the hat so that Moore’s law continues, and they seem to have just done it again. And since the improvements in computing efficiency go hand-in-hand with Moore’s law, continuing rapid developments in battery powered mobile computing devices are also "in the bag”.
One interesting thing is that the trends in computing efficiency actually predate Moore’s law, as they also applied to computers made using vacuum tubes and discrete transistors (as our article demonstrates empirically). So the efficiency trends are an inherent characteristic of electronic information technology, not just those powered by microprocessors.
For video of my talk at Microsoft last December on trends in computing efficiency, go here.
For a nice article in CNET about 3D transistors, go here.
Yesterday I tweeted about an innovation from MIT that converts infrared (IR) radiation to electricity, allowing for electricity generation from windows that appear transparent to the naked eye. The paper documenting those findings is here.
My good friend Kurt Brown, who I worked with in collaboration to design the recommendation engine for Wattbot, emailed me to tell me why he thought this was a crazy idea. First, he said vertical windows typically get only half of the insolation of a rooftop PV array, so the total available energy for conversion to electricity is much less than for rooftop panels. Second, he notes that PV panel costs are only 50% of the cost of PV installations nowadays, and while this innovation would substantially reduce panel costs, costs for the wiring and voltage controller to turn the electricity collected into useful power would be significant. He also forgot to mention that the energy from IR radiation is less than half of that contained in total solar insolation, which reduces the potential of this innovation to generate power still further.
I always listen to Kurt, particularly when he tells me I’m crazy, because he’s often right. However, I had some good reasons for highlighting the technology, so I encouraged Kurt to “think outside the box”. In this case, the box is that which says that electricity generated by transparent PVs in windows needs to get fed into the electric power system of the building. I think that’s how most folks read the MIT summary of this study, but it’s the wrong framing. The amount of power generated by this innovation will always be small, and Kurt is absolutely right that the costs of interconnecting the windows to feed their tidbit of electricity into the power system of a building would probably be prohibitive.
But what if the electricity from the windows could be used right then and there to do something useful? I thought of three examples, maybe you can come up with more:
1) A self powered skylight: If you put a small battery inside a skylight and use the IR PVs to charge that battery you wouldn’t need to wire the skylight to the conventional power system (that’s a big cost savings right there). It would be a self contained unit that opened and closed under its own power, and I’m sure it would sell like hotcakes.
2) Ventilation in automobiles: One of the big problems in autos is keeping them cool, and while there’s a lot you can do with window coatings, active cooling is almost always necessary in sunny climates. The electricity from window or sunroof based PVs could be used to run a small ventilation fan to cool vehicles in the sun, without draining the battery. This would be a boon for electric vehicles, for which battery storage is at a premium. There are products like this out there now, but none using this particular PV technology.
3) My favorite–Self powered electrochromic glazings: One of the biggest uncontrolled cooling loads for buildings is sunlight, and while coatings can help with this, having a system that can actively control shading would help buildings become much more flexible in their use of natural energy flows. Electrochromic materials can change their transparency depending on what voltage is applied to them. The IR PVs could generate enough power to activate the electrochromic materials and to run a wireless network through which all the windows in a building could be controlled (similar to the wireless sensor networks that are becoming more common nowadays). Electrochromics are now quite expensive but they are used in some commercial products (like sun roofs for high-end vehicles)–they would have to come down in price before this idea could come to fruition. This application would also require a battery, but would avoid the need for wiring, thus reducing installation costs.
After I told Kurt these ideas, he reconsidered his assessment. What do you think?