Was the Three Mile Island accident in 1979 the main cause of US nuclear power's woes?
It’s often stated that the Three Mile Island (TMI) accident in 1979 was the main cause of the demise of nuclear power in the United States. This line of argument posits that the safety regulations promulgated after TMI (along with associated legal wrangling) increased reactor costs and construction times so much that the industry could no longer compete. This argument has arisen anew in the aftermath of the nuclear meltdowns at Fukushima, in which people have been quick to draw parallels to TMI. In particular, some argue that the industry would have expanded in the 1980s were it not for the regulatory response after TMI, and caution against such a response again.
For example, a 2006 New York Times Magazine article stated “The received wisdom about the United States nuclear industry is that it began a long and inexorable decline immediately after the near meltdown, in 1979, at Three Mile Island in central Pennsylvania, an accident that — in one of those rare alignments of Hollywood fantasy and real-world events — was preceded by the release of the film “The China Syndrome” two weeks earlier.” The article then goes on to explain that the real story is more complicated than that, but the “received wisdom” still seems to be widely accepted.
A more recent example is contained in an op-ed in the Los Angeles Times by Mark Lynas:
“In the 1970s it looked as if nuclear power was going to play a much bigger role than eventually turned out to be the case. What happened was Three Mile Island, and the birth of an anti-nuclear movement that stopped dozens of half-built or proposed reactors…”
The op-ed contained some errors, laid out in a post by Joe Romm on Climate Progress (the errors about the area taken up by wind turbines and the area of Japan were fixed with a corrective note that is included in the current version of the op-ed). The important point for our purposes is that Lynas and others who make this argument are attempting to blame TMI and the anti-nuclear movement (which started well before TMI, it should be noted) for being the main factors stopping nuclear power plants either proposed or under construction. But the story is not nearly as simple as that.
What does this argument really mean?
Let’s begin by examining the argument itself so we are clear on the claim we’re evaluating. The complaint is that regulations after TMI unfairly burdened the industry, leading to increasing costs, longer construction times, and comparative economics that made it impossible for nuclear plants to compete with other sources of electricity. The emphasis on the unfairness of these regulations conveys the idea that somehow the regulators (prompted, it is implied, by the anti-nuclear movement) went too far after TMI, and that caused most of the industry’s problems.
In evaluating this claim it is worth keeping several factors in mind:
1) We will probably never know for sure exactly how much blame to assign TMI vs. other factors, because such historical events are usually so complex as to defy precise attribution after the fact.
2) It may be true that safety regulations following TMI did cause costs to increase and completion times to lengthen for plants under construction at the time. It may also be true that the regulators went overboard in some cases. What is certain, however, is that some increased regulatory stringency was justified after TMI, which was arguably the worst reactor accident the US had ever experienced. These regulations could therefore be seen as a justifiable expense, to the extent that the creation and enforcement of those regulations was not an overreaction to the accident.
3) TMI may also have made it impossible for the industry to ignore earlier regulations, or that enforcement of existing regulations became more stringent after TMI (this hypothesis came to us from Mark Cooper at Vermont Law School). It’s hard to argue against improved enforcement of existing regulations but if enforcement were overzealous or capricious, it could have had negative effects on the industry that were not justified by real safety risks. On the other hand, stricter enforcement may also fall into the category of real costs inherent to making the technology safe that had not fully been incorporated before TMI.
4) It is important to distinguish the effect of TMI (and the associated regulatory response) on plants that were already under construction in 1979 from its effect on potential future reactor orders. It is plausible that the regulations promulgated after TMI would have had some effect on reactors “in the pipeline”, but it’s far less clear that the absence of TMI would have helped the industry overcome the other factors that we discuss below somehow leading to new reactor orders after 1979, given the other big challenges the industry faced.
5) Other countries (like France, Germany, and the UK) faced cost escalation and plant delays without having reactor accidents comparable to TMI, so clearly other things were going on with the economics of reactors than just the response to TMI. See reference 10, Arnulf Grubler’s Energy Policy article on France, and Joe Romm’s blog post on French reactor costs for more details.
What do the data show?
To shed some light on this question, we revisited our data (see references, 4, 5, 6 and 8 below) and combined it with other data sources to determine what they could tell us about the effect of TMI on the US nuclear industry. In particular, we examined the history of US reactors, focusing on the year of project initiation (measured here as the approval of a construction permit), the year of project completion or cancellation, and the year of reactor shutdown (where applicable). It is clear from our review that TMI caused changes in safety regulations that increased costs (to some degree) and delayed construction of some plants that were already under construction (to some degree); however, it’s wise not to read too much into the importance of TMI. Even before the accident, nuclear plant costs were already rising rapidly and completion rates slowing (see references 1, 7, and 8), and while TMI might have accelerated these trends somewhat, they were already well underway by 1979. New reactor orders had slowed to a tiny trickle before TMI and the last US reactor order was in 1978 according to the Nuclear Energy Institute. All reactors ordered after 1973 were subsequently cancelled.
One historical example in support of these conclusions is reference 1 (Bupp and Derian 1981). This book, which is widely regarded as one of the most authoritative sources on the history of US nuclear power, was originally published in 1978 with the title: Light Water: How the Nuclear Dream Dissolved, indicating that many of the problems of the industry preceded TMI (we’re indebted to Peter Bradford for this insight).
The difference between the date of project initiation and project completion gives the construction duration for the reactor, which is one of the most important parameters affecting reactor costs. We used our database from reference 8 combined with two sources for cancellations, NRC and Clone Master. We cross checked the cancellation databases against each other to make sure they agreed, and when they disagreed we used the NRC data (the Clone Master data was in a more convenient form).
Figure 1 shows the annual history of reactor construction starts, completions, cancellations, and shut downs. No reactors were granted construction permits after 1979. It also shows that there were many cancellations of reactors before 1979. Finally, the bimodal nature of reactor completions suggests that construction slowed down around 1980, with completions picking up again in the mid 1980s.
Figure 1: US nuclear construction starts, completions, cancellations and shut downs by year (Copyright Jonathan Koomey 2011)
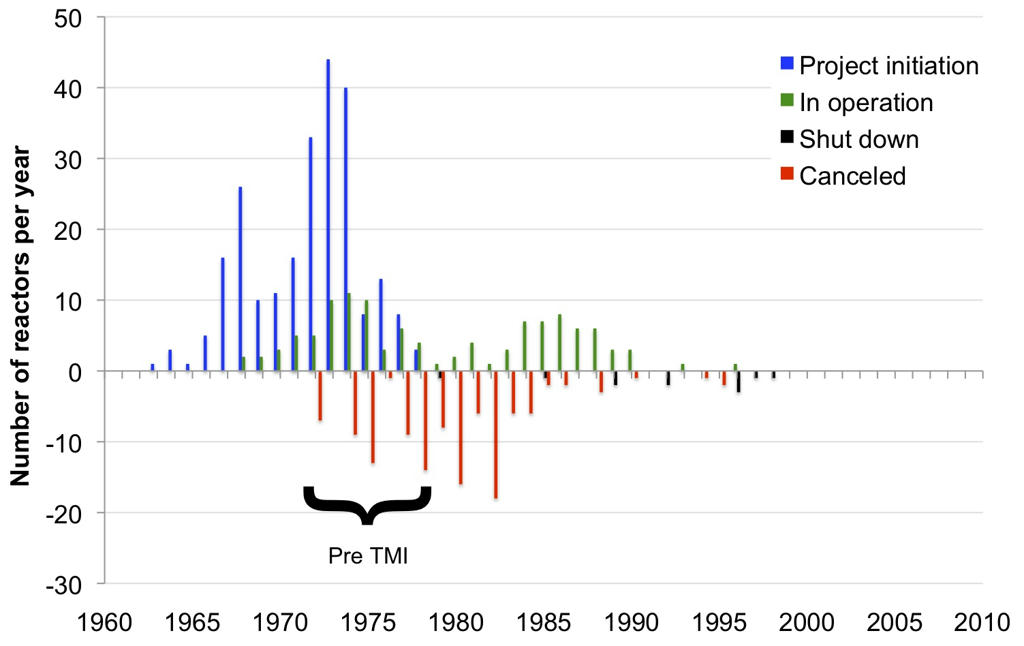
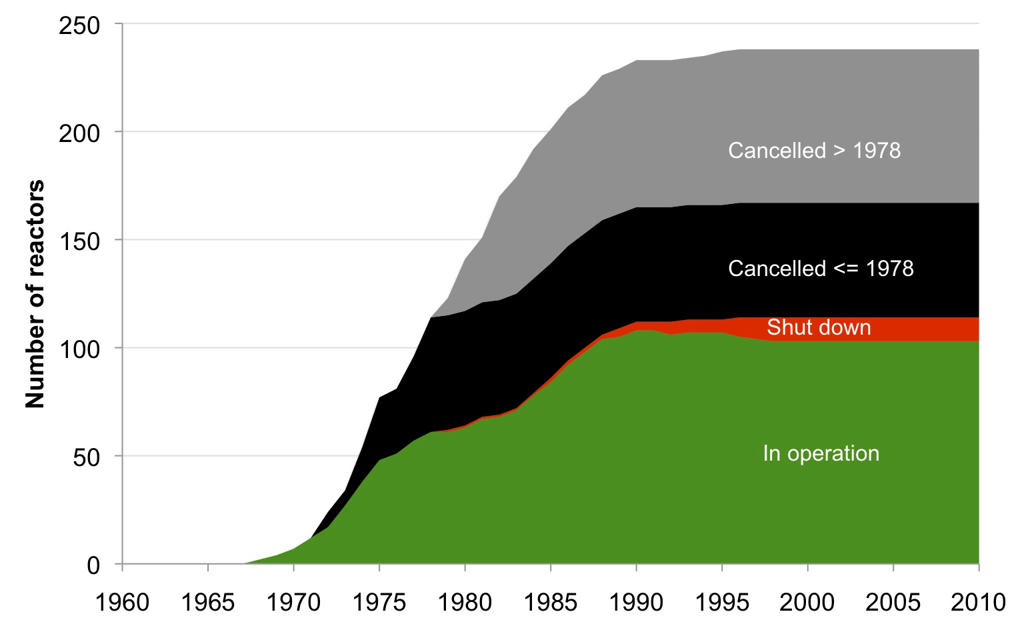
Figure 2 shows the annual data plotted cumulatively, which shows that more than half of all reactors ordered were subsequently cancelled. About 40% of all cancelled reactors were cancelled before 1979, and these can’t be attributed to TMI. That means that cost escalation and other forces afflicting the nuclear industry were well underway before TMI.
Figure 2: Cumulative US nuclear construction starts, completions, cancellations and shut downs (Copyright Jonathan Koomey 2011)
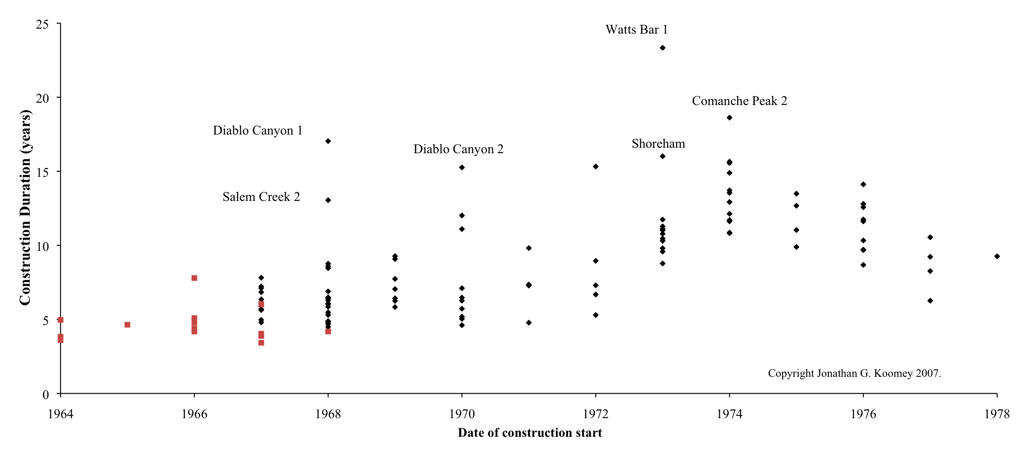
Now consider Figure 3, which shows construction duration as a function of construction start date (reactors in red were those early reactors for which we didn’t have cost data but for which we had construction duration data). The graph shows that the minimum construction duration for plants begun between 1966 and 1972 bounced around a bit but remained around 5 years, but it began to rise substantially for plants begun in 1973. It peaked in 1974, then declined again. These data are suggestive, but not conclusive. It is possible that plants begun in 1973 and 1974 were just far enough along in their construction process in 1979-80 for the changes in regulations from TMI (as well as the other factors discussed below) to have a significant effect on their construction duration. Plants started later were not as far along in construction in 1980 and were presumably easier to modify to reflect regulatory and other changes.
Figure 3: US reactor construction duration as a function of date of construction start (Copyright Jonathan Koomey 2011)
Chapter 6 of Charles Komanoff’s classic book Power Plant Cost Escalation (reference 7, which can be downloaded here) describes in great detail the character and scope of the changes in safety regulations that were likely to be the result of TMI. This chapter was written (according to Komanoff) in 1979-80, and his predictions were largely borne out. The changes were indeed substantial and there’s no doubt they affected the way reactors were constructed in the US. What is not clear is exactly how important these regulatory changes were compared to the other factors affecting the electric power industry at the same time. Komanoff gave his own list of 10 important factors here. Our own assessment of the most important factors combines some of Komanoff’s categories and include three additional factors–declining electricity demand growth, structural problems in the industry, and the rise of non-utility generation:
1) Declining demand growth for electricity, culminating in overcapacity in the early 1980s.
2) High interest rates
3) Structural problems in the industry
4) Changing public perceptions of the credibility of the nuclear industry.
5) The rise of the independent power industry in the US combined with restructuring and integrated resource planning.
Let's examine each of these in turn.
1) Electricity demand growth: We plotted the annual rate of change in electricity consumption from 1949 to 2009 using EIA Annual Energy Review data (see Figure 4). We also plotted a lagging 5 year average starting in 1954 (for the few years before that we averaged the years we had, starting with the 1st year, then averaging years 1 and 2, then years 1,2, and 3, then years 1, 2, 3, 4). While there are more sophisticated ways to analyze trends, this simple approach is both easy to explain and also illustrative of the kind of analysis typical utility analysts would have conducted of those trends in the 1970s and 80s.
Figure 4: US electricity consumption growth over time (Copyright Jonathan Koomey 2011)
From around 1960 until the early 1970s electricity demand was growing steadily and rapidly at about 7% per year. The 1973 and 1979 oil shocks reduced demand growth to around 3% per year from the late 1970s until the early 1990s, and the volatility of demand from year to year increased a great deal. From the early 1990s through 2008 electricity demand growth declined from around 2.5%/year to around 1% per year, and then absolute demand dropped significantly in 2009 as a result of the global economic crisis.
An environment of declining electricity demand growth accompanied by increased volatility is a difficult one for long lead-time capital-intensive projects like nuclear plants, as NRC Commissioner Victor Gilinsky argued in January 1980 (reference 2). The construction of such plants is predicated on sufficient and reliable demand growth, and when growth slows, the economic justification for such plants deteriorates rapidly. We (and Commissioner Gilinsky) believe this factor was one of the most important ones that led to longer lead times and higher construction costs. Further analysis is needed to see just how important it was, and a state by state regression analysis that correlated construction lead times with state level electricity growth data would probably yield insights.
The end result of declining demand growth and the utility construction boom of the 1970s was overcapacity in the early 1980s (many utilities argued that high demand growth would return, so they kept building plants). The EEI Statistical Yearbook of the Electric Utility Industry gives data on capacity margins (defined as the difference between installed capacity and peak demand divided by installed capacity). The term reserve margin is actually a more common term and it is defined similarly (reserve margin is the difference between installed capacity and peak demand divided by peak demand).
Figure 5 shows reserve margins calculated from the EEI capacity margin data for 1963 through 1984 (we’re working on getting the EEI data for later years). Utilities typically target reserve margins of 15-20% to preserve reliability, and they did so successfully from 1966 through 1973. Things changed in 1974, when reserve margin jumped to 27% in 1974 and 35% in 1975, and stayed between 30% and 41% through 1984. These data indicate overcapacity on a large scale. To truly understand the importance of this factor would require state-by-state or regional analysis, but the overcapacity in the early 1980s was large enough at the national level to suggest that it probably affected utility decisions about the rate of construction progress on nuclear plants under construction.
Figure 5: US electric utility reserve margins 1963-1984 (Copyright Jonathan Koomey 2011)
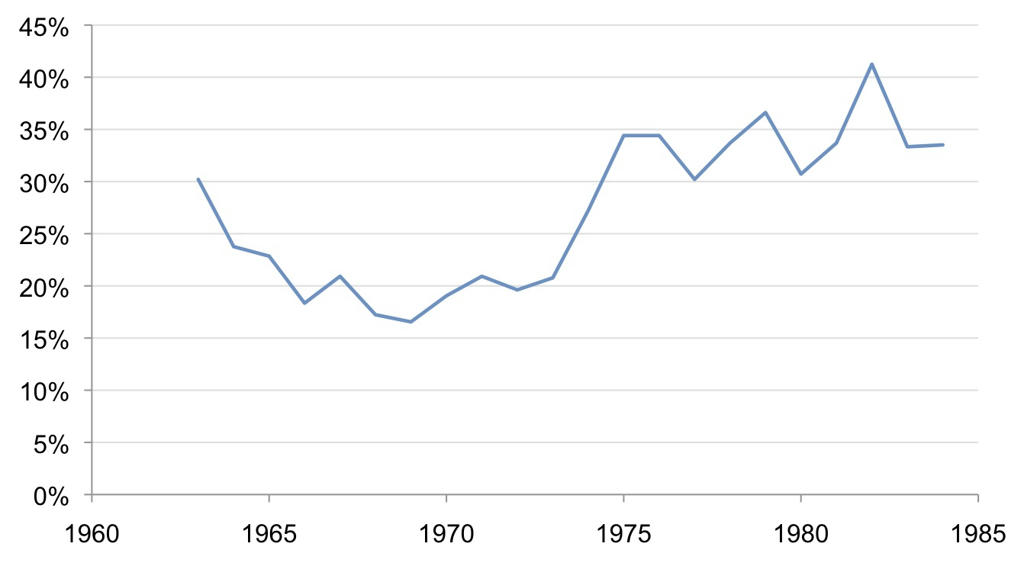
Source: The EEI Statistical Yearbook of the Electric Utility Industry
For a fascinating contemporaneous account of the important effects of declining demand growth on the decision making of utilities in Illinois circa 1980, go here. That account, by the journalist William Lambrecht, stated:
“The Three Mile Island nuclear accident near Harrisburg, Pa., shook public perception of nuclear power, while resulting in new safeguards required by the Nuclear Regulatory Commission. But it apparently contributed less to the industry slowdown than is commonly believed, and substantially less than the simple effects of supply and demand. In the late 1960’s and early 1970’s, when many utilities drew expansion plans of grandiose proportions, the average estimated load growth rate around the country was 7 percent annually.”
“However, the 1973 oil embargo by Arab nations set in motion a chain of events that would markedly alter patterns of energy consumption. In the words of Scott Peters of the Atomic Industrial Forum, ‘Utilities suddenly found that they were overcommitted, and their load growth projections had to be tossed in the wastebasket.’ ”
Soon after TMI it was clear to some observers (like Gilinsky and Lambrecht) that overcapacity caused in part by lower demand growth led some utilities to slow down construction of reactors in the pipeline. It also had a chilling effect on the market for new reactors.
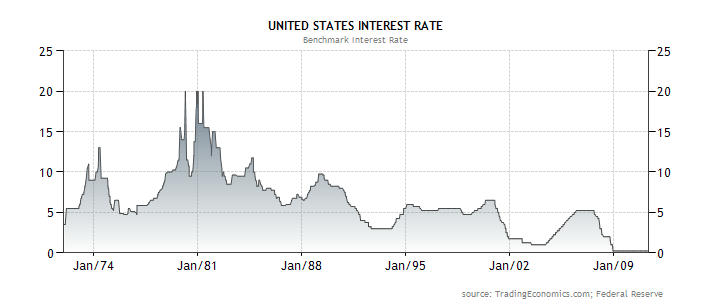
2) Interest rates peaked at around 20% in the 1979 to 1981 period, according to the site Tradingeconomics (see the site Economagic for a time series of the US prime rate, which also peaks at 20% in 1980-81). While it’s not clear exactly which interest rates TradingEconomics used as the proxy for US rates, the graph from that site (Figure 6) is striking, and the message unmistakeable: at the same time as TMI occurred, interest rates were at unprecedented levels. That had to weigh heavily on the financing and cash flows of an industry constructing capital-intensive power plants, and this had absolutely nothing to do with TMI.
Figure 6: Nominal US interest rates over time
3) Structural problems in the industry: in the late 1960s and early 1970s, the industry rushed to build plants before sufficient experience had been gained with the earlier generation of reactors, with the assumption that economies of unit scale would continue to accrue without corresponding diseconomies (references 1 and 3 show that this assumption turned out not to be correct). At the same time, many reactors started construction with as little as 10% of their design completed, which made them even more subject to cost escalation than they would otherwise have been (see reference 8 for some discussion on this point).
4) Changing perceptions of the nuclear industry: TMI represented a pivotal event that made the public think twice about supporting nuclear power, in large part because the nuclear industry had assured us that such an accident couldn’t happen here. There were other such events that had a similar effect (See Komanoff's “10 blows” article for more details): those included a fire at Brown’s Ferry in 1975, three former GE nuclear engineers who joined antinuclear organizations, and the reversal of pipes at the Diablo Canyon reactors in 1981 that “virtually [disabled] their seismic protection systems”. These events, combined with TMI, served to undermine the credibility of the nuclear industry in a way that had lasting effects (and these effects were distinct from the effect of the new safety regulations imposed by the NRC after TMI).
5) The rise of the US independent power industry and the increasing prevalence of restructuring/deregulation: In one of the great success stories of new technology development in the past few decades, the independent power industry arose from humble origins to dominate the supply of new electric generation capacity in the US. As Peter Bradford argued in a Wall Street Journal Book Review, “Nuclear-plant construction in this country came to a halt because a law passed in 1978 [PURPA] created competitive markets for power. These markets required investors rather than utility customers to assume the risk of cost overruns, plant cancellations and poor operation. Today, private investors still shun the risks of building new reactors in all nations that employ power markets.”
This shift of expectations about who was responsible for funding the development of new supply resources coincided with the rise of what’s called “Integrated Resource Planning” (IRP) or “Least Cost Planning” (LCP), which encouraged utilities to do a least-cost integration of all resources, including energy efficiency. The conceptual foundations of this approach were fully fleshed out by the late 1980s (see reference 9). The net result of this new approach was to bring previously ignored utility resources (like independent power generation and energy efficiency) into the mainstream, and made it possible for utilities to avoid building new capacity using standard financing methods.
As one example of the effect of those changes, see Figure 7 below. This figure shows utility and non-utility generation over time from US EIA data. Non-utility generation dropped from 108 BkWh/year in 1970 to 71 BkWh/year in 1979. It began to rise after 1979 and by 1995 it had reached almost 400 BkWh/year, which is the equivalent of 133 typical 500 MW coal plants. This graph is a testament to the effects of the changes in utility resource acquisition practices that came into use after the passage of the Public Utility Regulatory Policies Act of 1978 (PURPA).
Figure 7: US utility and non-utility net generation 1970 to 1996 (billion kWh/year, Copyright Jonathan Koomey, 2011)
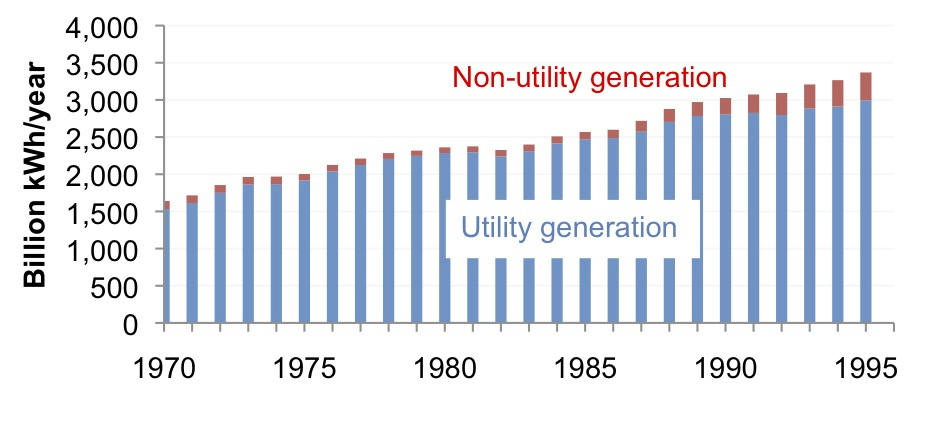
Source: EIA, The changing structure of the electric utility industry: An update 1996, with data on non-utility generation interpolated between 1979 and 1985.
Conclusions
The nuclear industry faced big challenges even before TMI: of all reactors cancelled, 40% of were abandoned before 1979. The interlinked issues of declining demand growth, high interest rates, nuclear industry structural problems, changing public perceptions, and the rise of alternative means of acquiring utility resources all had powerful effects on the viability of the nuclear enterprise. It is therefore not correct to conclude that the Three Mile Island accident was the sole or even the most important factor leading to the difficulties the US industry has faced. The accident clearly had some effect on reactors then under construction, but we are convinced that the other factors we list above were in the aggregate more important than TMI in their effect on the likelihood of new nuclear orders in the post-TMI period.
–Jonathan Koomey and Nate Hultman
Acknowledgements
This post benefited greatly from discussions with Peter Bradford, Ralph Cavanagh, Mark Cooper, Victor Gilinsky, Jim Harding, Charles Komanoff, Amory Lovins, and Joe Romm. We’d also like to thank Gregory Carlock, who helped us with data collection and analysis.
References
1. Bupp, Irvin C., and Jean-Claude Derian. 1981. The Failed Promise of Nuclear Power: The Story of Light Water. New York, NY: Basic Books, Inc.
2. Gilinsky, Victor. 1980. “The Impact of Three Mile Island.” In The Bulletin of the Atomic Scientists. January. pp. 18-20.
3. Hirsh, Richard. 1989. Technology and Transformation in the American Electric Power Industry. Cambridge and New York: Cambridge University Press.
4. Hultman, Nathan, and Jonathan Koomey. 2009. The Real Risk of Nuclear Power. Washington, DC: The Brookings Institution. December 2. <http://www.brookings.edu/opinions/2009/1202_nuclear_power_hultman.aspx>
5. Hultman, Nathan E., and Jonathan G. Koomey. 2007. “The risk of surprise in energy technology costs." Environmental Research Letters. vol. 2, no. 034002. July. <http://www.iop.org/EJ/abstract/1748-9326/2/3/034002/>
6. Hultman, Nathan E., Jonathan G. Koomey, and Daniel M. Kammen. 2007. "What history can teach us about the future costs of U.S. nuclear power." Environmental Science & Technology. vol. 41, no. 7. April 1. pp. 2088-2093.
7. Komanoff, C. 1981. Power plant cost escalation: Nuclear and coal capital costs, regulation and economics. New York: Van Nostrand Reinhold Publ. Co.
8. Koomey, Jonathan G., and Nathan E. Hultman. 2007. "A reactor-level analysis of busbar costs for U.S. nuclear plants, 1970-2005." Energy Policy. vol. 35, no. 11. November. pp. 5630-5642. <http://dx.doi.org/10.1016/j.enpol.2007.06.005> (Subscription required).
9. Krause, Florentin, and Joseph Eto. 1988. Least-Cost Utility Planning: A Handbook for Public Utility Commissioners (v.2): The Demand Side: Conceptual and Methodological Issues. National Association of Regulatory Utility Commissioners, Washington, DC. December.
10. Krause, Florentin, Jonathan Koomey, David Olivier, Pierre Radanne, and Mycle Schneider. 1994. Nuclear Power: The Cost and Potential of Low-Carbon Resource Options in Western Europe. El Cerrito, CA: International Project for Sustainable Energy Paths. <http://www.mediafire.com/file/kjwo9gjwtj5p11t/nuclearpowerbook.pdf>
