Reviewing fleet average onsite water and infrastructure energy efficiency for the top twenty global data center operators
The continued expansion of the global data center industry has drawn increasing attention to onsite water use and the energy efficiency of infrastructure (which is linked to water used in cooling) [1]. Some data centers rely on water primarily for cooling, and as the sector grows, so does interest in understanding the scale and efficiency of that use.
Our new white paper, released this morning, examines the onsite water use of data centers and related estimates of the efficiency of infrastructure energy use. The analysis draws on company-reported fleet average data from the most recently available reporting periods for the top twenty global data center companies as assessed by Data Centre Magazine in 2025.
The data center industry characterizes onsite water use intensity by calculating onsite Water Usage Effectiveness or WUE [2], using Equation 1:

WUE is the standard metric for evaluating the water efficiency of data center operations. It is expressed in liters of water per kilowatt-hour of computing electricity consumed on the data center premises (l/kWh). WUE can be reported on both a consumption and a withdrawal basis.
Water consumption refers to water that is used in the data center and subsequently lost through evaporation, drift, and other processes. Water withdrawal is the total volume of water extracted from any source for use in the data center. Withdrawal includes both water that is consumed and water that is returned to the water system in compliance with applicable standards. Withdrawal and consumption are related using Equation 2:

Accordingly, WUEconsumption (l/kWh) captures only the water lost at the data center while WUEwithdrawal (l/kWh) captures total water extracted for all purposes for the data center, regardless of whether that water is ultimately returned to the local watershed. Water that is withdrawn but not consumed can also affect the local watershed by temporarily reducing availability.
An additional complexity is that some data centers use reclaimed municipal wastewater or other recycled water [3], and accounting for such reclaimed water must be explicit when comparing WUE values from different companies, but it almost never is. Neither of the current protocols for estimating WUE differentiates between reclaimed water or potable water or from other sources [4, 5].
There is also water use associated with electricity generation [6], which means there can be tradeoffs between onsite water use and utility sector water use. Neither reclaimed water nor utility-sector water use are covered in this white paper.
The WUE equation mirrors the more commonly used metric for data center infrastructure power efficiency called the Power Usage Effectiveness or PUE [7], as shown in Equation 3:

PUE is a dimensionless ratio with a theoretical minimum value of 1.0. If PUE = 1.2, that means that for every kWh of computing electricity use there is another 0.2 kWh of other electricity use for cooling, fans, pumps, and power distribution losses. WUE and PUE are related in complex ways, but onsite water use can often lead to lower PUEs [8].
We identified published reports, news releases, and company blog posts by the top twenty data center operators and (where public data were available) compiled reported fleet-average WUE and PUE estimates. Figure 1 plots fleet average data for the thirteen companies that report both metrics, with data points color-coded by WUE basis: withdrawal (blue), consumption (orange), or unknown (gray). The variance in Figure 1 reflects differences in operational models, facility design, fleet composition, and historical technology choices.
Figure 1: PUE and onsite WUE by data center operator
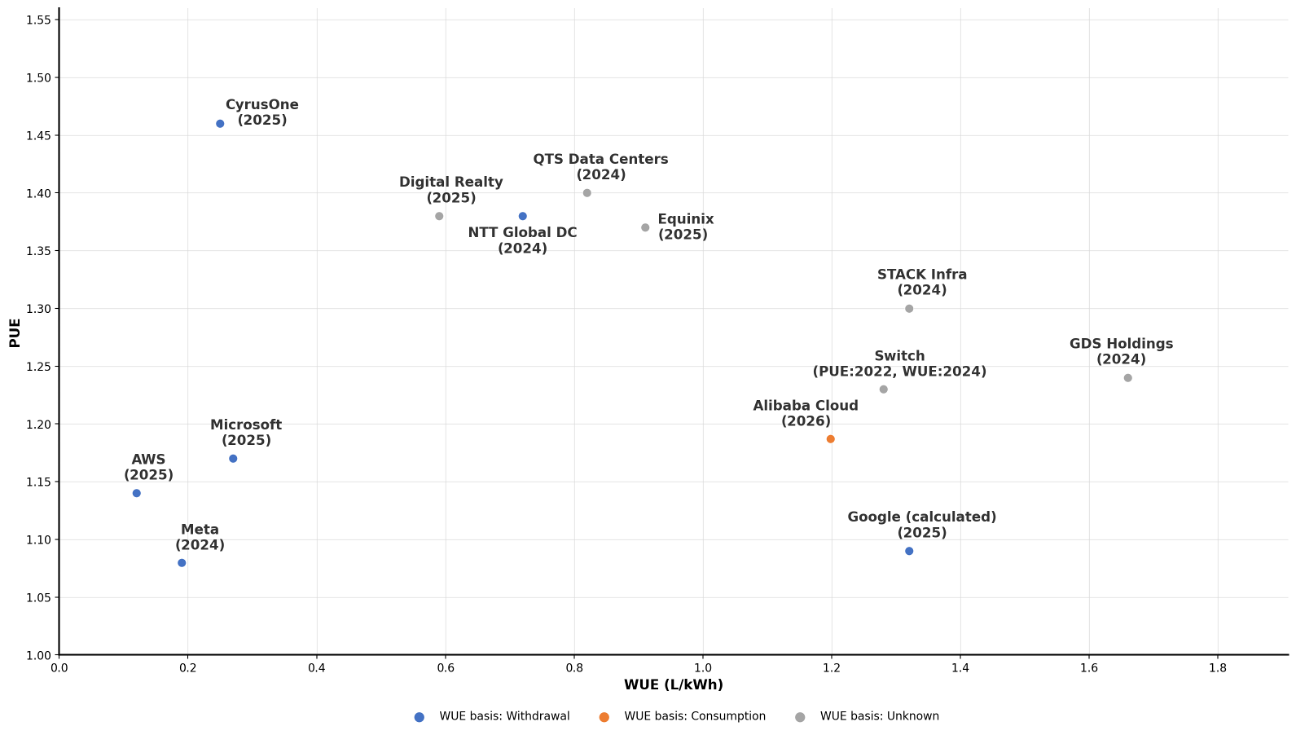
Notes: Calculated value for Google is based on reported fleet-average data center water withdrawals and electricity consumption from Google's 2026 sustainability report [9]. To download a high resolution pdf version of the graph click here.
Operators that control IT workloads, IT equipment specifications, and facility design and operations can co-optimize server thermal tolerances, cooling design, and building configuration as a single system. Operators that serve multiple tenants typically control only the facility and must provision cooling for heterogeneous customer workloads with varying density, airflow, and thermal requirements. Similarly, operators with predominantly newer, purpose-built facilities have more flexibility to deploy current cooling technologies, while those with older portfolios face retrofit constraints that can limit fleet-level performance. It is also worth noting that seven of the twenty operators assessed do not report WUE publicly, which limits valid cross-industry comparisons.
The data indicate that operators with vertically integrated, purpose-built infrastructure tend to achieve lower PUE and WUE, though outcomes depend on cooling technology, fleet composition, historical technology choices, and geographic footprint. AWS and Meta deliver the lowest fleet WUE values, in that order; when PUE and WUE are considered together, Meta achieves the lowest combined values, followed by AWS, consistent with holistic approaches that co-optimize water and energy use. More research is needed on drivers of onsite water use differences, including climate, cooling system architecture, and the water implications of onsite water use for cooling [8].
Acknowledgements
We are grateful to Amazon Web Services for funding this research. The authors retained full analytical and editorial independence throughout. All analysis and writing was conducted solely by the authors.
References
1. Shehabi, Arman, Sarah Josephine Smith, Alex Hubbard, Alexander Newkirk, Nuoa Lei, Md AbuBakar Siddik, Billie Holecek, Jonathan G Koomey, Eric R Masanet, and Dale A Sartor. 2024. 2024 United States Data Center Energy Usage Report. Lawrence Berkeley National Laboratory. LBNL-2001637. December 19. [https://escholarship.org/uc/item/32d6m0d1]
2. The Green Grid. 2011. Water Usage Effectiveness: A Green Grid Data Center Sustainability Metric. The Green Grid. March 1. [https://www.thegreengrid.org/en/resources/library-and-tools/238-WP%2335---Water-Usage-Effectiveness-%28WUE%29%3A-A-Green-Grid-Data-Center-Sustainability-Metric]
3. Koomey, Jonathan, and Zachary Schmidt. 2026. Prevalence of reclaimed municipal water use for cooling for the top ten global data center operators: A preliminary analysis. Bay Area, California: Koomey Analytics. January 13. [https://www.koomey.com/koomey_blog/an-empirical-assessment-of-data-center-sites-using-reclaimed-municipal-wastewater-for-cooling/]
4. Patterson, Michael, Dan Azevedo, Christian Belady, and Jack Pouchet. 2011. Water Usage Effectiveness (WUE™): A Green Grid Data Center Sustainability Metric. The Green Grid. White Paper #35. March 1. [https://www.thegreengrid.org/en/resources/library-and-tools/238-WP#35---Water-Usage-Effectiveness-(WUE):-A-Green-Grid-Data-Center-Sustainability-Metric-]
5. ISO, and IEC. 2022. Information technology — Data centres key performance indicators – Part 9: Water usage effectiveness (WUE). International Organization for Standardization and International Electrotechnical Commission. ISO/IEC 30134-9:2022. March. [https://www.iso.org/standard/77692.html]
6. Peer, Rebecca A. M., Emily Grubert, and Kelly T. Sanders. 2019. "A regional assessment of the water embedded in the US electricity system." Environmental Research Letters. vol. 14, no. 8. 2019/07/29. pp. 084014. [http://dx.doi.org/10.1088/1748-9326/ab2daa]
7. The Green Grid. 2007. Green Grid Metrics: Describing Data Center Power Efficiency. The Green Grid, Technical Committee. [http://www.thegreengrid.org/pages/content.html]
8. Lei, Nuoa, Jun Lu, Arman Shehabi, and Eric Masanet. 2025. "The water use of data center workloads: A review and assessment of key determinants." Resources, Conservation and Recycling. vol. 219, 2025/06/01/. pp. 108310. [https://www.sciencedirect.com/science/article/pii/S0921344925001892]
9. Google. 2026. Google environmental report 2026. Mountain View, CA: Google. June. [https://sustainability.google/reports/google-2026-environmental-report]

