In 2011, we replaced lighting cans with LED inserts in our house, instantly reducing lighting energy use by 50% or more. The inserts looked like the ones on the left in the photos below.
Recently (September 2023) I needed to buy a few more to replace some of the old ones that failed. The new ones look like the one on the right in the photos. Both give 700 lumens of light output.
The old ones (with the little wire that screws into the socket) weigh 486 grams, use 11 W, have a color temperature of 3000 K, are about 11.9 cm high, and cost $50 each.
The newest ones weigh 226 grams, use 10 W, have a more pleasing color temperature of 2700 K, are about 6.3 cm tall, cost $11 each, and occupy less than half the volume of the 2011 version.
In a dozen years the price has come down a factor of nine, volume and weight are down by a factor of two (making shipping easier and less expensive), efficiency has improved about 9%, and lighting quality has improved. Not too shabby!
Technological progress like this is why Amory Lovins calls efficiency a renewable resource. It keeps getting better and cheaper over time!
For an intermediate look at the state of this technology in 2019, go here.
Every year since Chris Nelder started the Energy Transition Show, he’s interviewed me for the annual roundup episode, and this year is no exception. We discuss the proper role of government in a capitalist economy, climate change doomism, how the fossil fuel industry rigs the system, and the difficulties of the mid-transition as we shift away from conventional energy systems.
I, along with colleagues at World Resources Institute and Koomey Analytics, just had a commentary published in WIRES Climate Change. It’s titled “Abandon the idea of an ‘optimal economic path’ for climate policy”.
Many economic modelers think that if given enough time, money, graduate students, and coffee they can estimate an “optimal economic path” for climate mitigation that extends far into the future. They further argue that this path is the correct or best way to guide climate policy design.
The most prominent example is that of Nobel prize winning professor William Nordhaus, the father of cost-benefit or benefit-cost analysis for climate [1]. In his 2018 Nobel acceptance speech, Nordhaus [2] said:
[I]n the view of most economists, balancing of costs and benefits is the most satisfactory way to develop climate policy.
[O]ne of the most amazing results of Integrated Assessment Models (IAMs) is the ability to calculate the optimal carbon price…This concept represents the economic cost caused by an additional ton of carbon dioxide emissions (or more succinctly carbon) or its equivalent…In an optimized climate policy (abstracting away from various distortions), the social cost of carbon will equal the carbon price or the carbon tax.
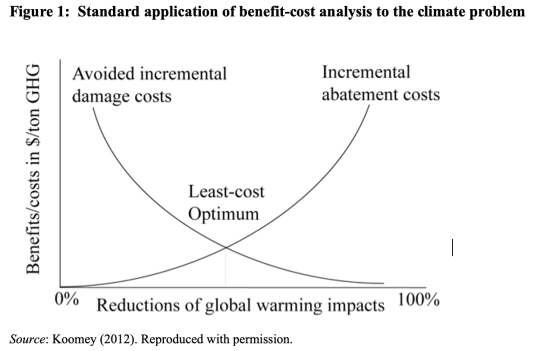
Nordhaus argues that IAMs can estimate carbon prices that optimize global consumption, emissions, and climate change, balancing mitigation or abatement costs against benefits of reducing emissions (like risk reduction and avoided climate damages). Similar analyses, focused on damage costs, are used to assess appropriate social costs of carbon for regulatory purposes [3].
This way of framing the problem can be summarized in the following graph, which depicts benefit and cost curves in stylized fashion. It characterizes the place where the two curves cross as the “optimal” level of GHG reductions, where the marginal cost of reducing emissions is equal to the marginal benefits from reducing them. The point also suggests the optimal carbon price, as in the Nordhaus quotation above. In this view, reducing emissions beyond that point would imply that we are paying too much for emissions reductions because the costs for incremental emissions reductions would exceed the benefits.
This commentary focuses attention on underlying ideas about “optimal paths” that are in our view not widely enough understood and are often unstated, namely that
(1) there IS a single unique optimal path to solving the climate problem,
(2) this path exists independent of human choices, and
(3) society can discover this path in advance through better data collection, analysis, and logical thinking.
These beliefs are at odds with our current understanding of the forces driving the development of real economic and technological systems, which are dominated by increasing returns to scale, network externalities, learning curves, and other non-linear effects. Real non-linear systems are subject to “sensitive dependence on initial conditions”, which leads to chaotic and often unpredictable behavior of such systems in the face of imperfect measurements, randomness, and human choices [4, 5, 6, 7, 8]. Models of non-linear systems are also strongly affected by uncertainties in model structure, complicating things still further [9].
The full reference for the commentary is
Koomey, Jonathan, Zachary Schmidt, Karl Hausker, and Dan Lashof. 2023. “Abandon the idea of an “optimal economic path” for climate policy.” Invited Commentary for WIREs Climate Change. vol. e850, July 2. [http://doi.org/10.1002/wcc.850]
To download a pre-publication version of the article, click here.
3. US EPA. 2022. Report on the Social Cost of Greenhouse Gases: Estimates Incorporating Recent Scientific Advances. Washington, DC: U.S. Environmental Protection Agency. September. [https://www.epa.gov/environmental-economics/scghg]
7. Pluchino, Alessandro, Alessio Emanuele Biondo, and Andrea Rapisarda. 2018. “Talent versus luck: The role of randomness in success and failure.” Advances in Complex Systems. vol. 21, no. 03n04. pp. 1850014. [https://www.worldscientific.com/doi/abs/10.1142/S0219525918500145]
9. Thompson, Erica. 2022. Escape from model land: How mathematical models can lead us astray and what we can do about it. New York, NY: Basic Books. [https://amzn.to/3HDxH5t]
On June 19th and 20th, 2023, students and colleagues of Arnulf gathered at Oxford for a symposium to honor him and discuss data and methods for understanding technology and global change for the next twenty five years.
The workshop was organized by Charlie Wilson of Oxford and Greg Nemet at the University of Wisconsin, Madison, and was attended by a stellar cast of researchers and practitioners, some of whom I knew, others I was glad to have met for the first time at the workshop.
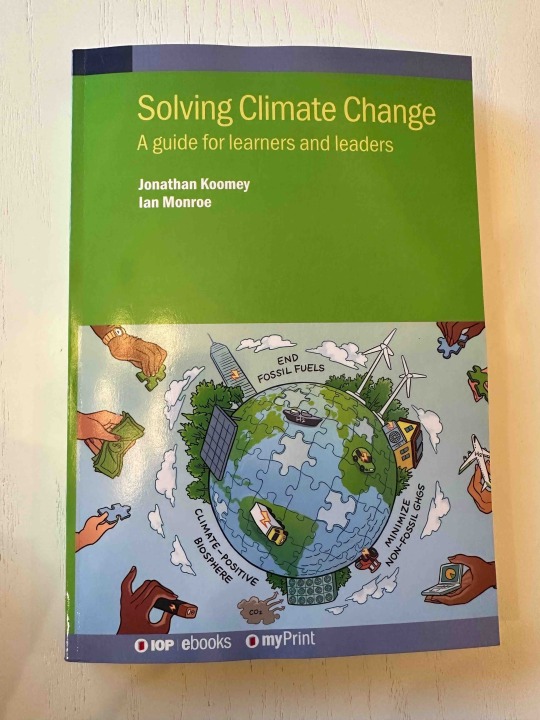
Ian Monroe and I talked with Allyson Klein at Tech Arena for her podcast about our book, Solving Climate Change: A Guide for Learners and Leaders. It’s a half hour conversation that covers many of the key lessons from our textbook. We think you’ll enjoy it.
Allyson was at Intel for many years and I had talked with her back in 2012 (and probably more recently) about ICT electricity use on her “Chip Chat” interview show.
On May 10, 2023, Ian Monroe and I gave a live webinar for the Institute of Physics (IOP) about our latest book, Solving Climate Change: A Guide for Learners and Leaders. The webinar is still posted at the Physics World website, and if you register you can watch it on demand:
Instructors can request an examination copy from IOP publishing: shorturl.at/qrLM0
After that webinar, four questions came back from the audience. Ian and I answered them, and I thought it would be good to post them here as well.
If you listen to the webinar or read the book and have questions, Email me and we’ll add them to the list of answered questions so others can benefit.
Question 1: For an individual with limited reach, do you have any advice when it comes to dealing with friends and family that are unwilling to listen to these facts and change their behavior to minimize their impact? It can be quite frustrating while having to deal with climate anxiety as well.
Getting people to change their habits is hard, but we need all levels of action to decarbonize our global economy. One of the most important things is to vote for politicians who promise real climate action, because the SYSTEM needs to change to get the emissions reductions we need. Politicians are much more likely to enact good climate policies if individual voters are demanding them, and individual spending and investment decisions can also influence companies who then influence politicians. Most people already support renewable energy and energy efficiency because they save people money and are cleaner than fossil alternatives.
To change people’s behavior, we’ve found that leading with the benefits of new technology (distinct from emissions reductions) can often be effective. Electric vehicles are cheaper to run, are cleaner, and are more fun to drive. Electric heat pumps generate no carbon monoxide, are quieter, are often cheaper to run, and are cheaper to install when replacing a furnace/AC combo (because heat pumps replace two pieces of equipment with one). Switching to electric cooking also improves indoor air quality, reducing the likelihood of asthma. Eating plant-based foods and reducing red meat generally improves overall health.
There are some online resources that can help. This one is great (and funny):
Question 2: In Mexico City we have students that spend a lot of time getting to college, sometimes 1 or 2 hours to arrive there. To promote remote work and less commuting, do you recommend online courses, in particular for engineering and sciences students? Teachers are reluctant to this change.
We are huge fans of remote work and study. As Amory Lovins says, move the electrons, leave the heavy nuclei at home! It’s vastly less emissions intensive to conduct lessons remotely. It takes different preparation for professors but it’s not clear that it takes more preparation, and the benefits are big, not just for climate, but also for quality of life. While it can be hard to fully replace the benefits of in-person instruction, hybrid systems where remote instruction is paired with limited in-person meetings can provide similar benefits, and we have increasingly better tools for replicating in-person experiences with online alternatives (which younger generations often prefer).
Question 3: You didn’t seem to mention reducing energy use. Is it wise not to assume this will happen?
Using energy more efficiently is great, but in the book we focus on what we call emissions efficiency and optimization, because energy efficiency is too narrow a frame for this problem. There is no question that we can reduce waste and eliminate unproductive uses of energy, but when energy is produced renewably, it may be just fine from an emissions perspective to use more.
In addition, the switch to electricity, which eliminates many sources of losses in combustion when electricity is generated from renewables, will result in a substantial increase in electricity use while significantly reducing fossil fuel energy use. Combustion losses are so significant in the current economy (somewhere around 20-30 % of total primary energy) that eliminating them will result in substantial energy savings for society even as electricity use goes up.
Question 4: I wish to know what actions can be taken in developing economies that depend on oil so well & are not anywhere near the expected green electrification needed to achieve a net zero carbon emissions footprint.
There is no need for developing countries to repeat our mistakes, especially since the alternatives to fossil fuels are now cheaper in societal terms virtually everywhere and cheaper in direct cost terms in many cases. There is no case for expanding fossil fuel infrastructure anywhere on the planet (with very few exceptions). Most electrification, renewable energy, and other climate solution technologies have even greater economic, health, and wellbeing benefits for developing economies that currently suffer proportionally more from existing fossil fuel and unsustainable agriculture pollution and economic distortion. Most fossil infrastructure expansion proposals are now being driven by fossil fuel interests because they want to lock in users as much as possible before serious emissions reductions begin. Their strategy is what the futurist Alex Steffen correctly calls “predatory delay”.
Electrifying two wheeled vehicles is already happening rapidly in the developing world, as is deployment of renewables in some places. China is now by far the world’s leader in scaling up electric vehicle, and while China now leads in electric car, bus, and truck production, China started by producing hundreds of millions of electric scooters and bikes, which cost less to run than the fossil-fueled vehicles they replace. The key is to overcome the power of vested interests, who want to delay action for as long as possible (because it benefits them).
Another step many countries can take is to protect natural areas from further destruction, to maintain the ecosystem services they provide while responsibly developing industries (like tourism) that thrive when forests and other natural systems are healthy.
Solving Climate Change: A Guide for Learners and Leaders, was released in late December 2022. The publisher, IOP, recently made if freely downloadable through May 21, 2023, so get it while it’s still free!
My talk on February 9, 2023 for the Salinas Rotary club is an expansion of points made in a commentary article by me and Professor Eric Masanet, UCSB, in Joule in 2021:
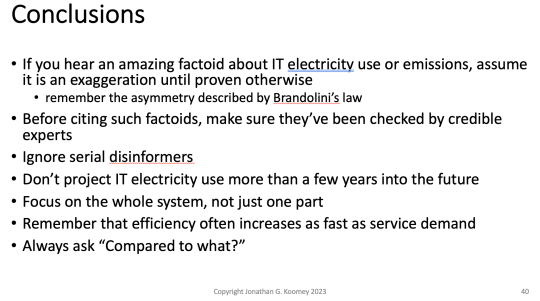
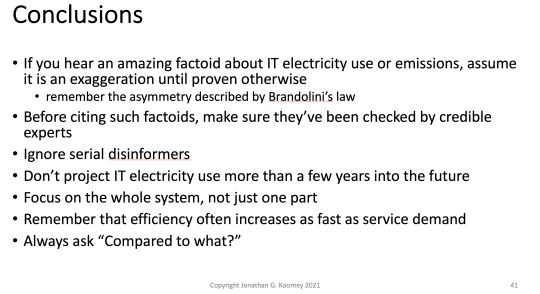
In the talk, I presented nine different high-profile misconceptions about electricity use and emissions associated with computing, explored four pitfalls that lead to such misconceptions, and suggested four ways we can do better in the future.
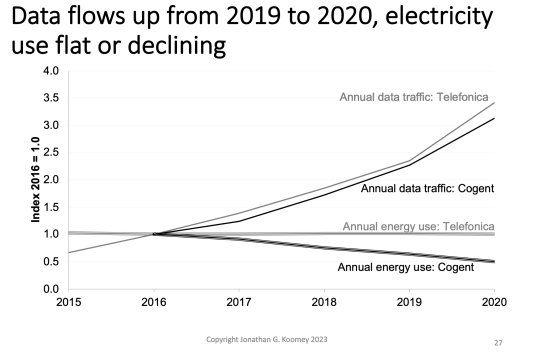
Here is a graph illustrating that substantial increases in information technology services, in this case data flows, does not necessarily imply increases in energy use.
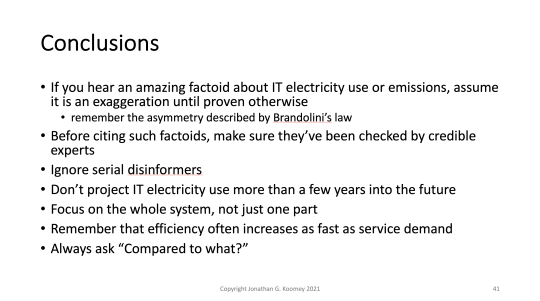
Here is the conclusions slide:
You can download a PDF of the slides (which include three pages of references) HERE.
The purpose of this commentary is to explain why we think even “clustered horizontal” targets, like the ones currently being analyzed by the California Energy Commission (Pasha 2021), will be challenging to develop for devices incorporating information and communication technology. We don’t think it is impossible to create horizontal targets in all cases, but we are convinced, because of the fast-moving nature of these technologies and the increasing integration of IT with the primary functions of most devices, that horizontal targets of any type (even more precisely targeted ones) will face unique headwinds.
Please email me if you don’t have access via the DOI link below or click on the sharing link above (in the first paragraph). The supplemental information is a white paper that contains more technical analysis and details supporting our arguments in the commentary.
Abstract
Efficiency of electronic devices is an area of active interest by policy makers in the European Union and elsewhere. Efforts to create a uniform horizontal efficiency standard (one that applies to many different types of equipment) have worked in the past, but as standards become more stringent, the need for product-by-product differentiation for such standards becomes more pressing.
Devising sensible regulations requires making reasonable average power consumption estimates for groups of components that reflect how they would actually be used in real products, not just treating components in isolation. Deep interactions between regulators and manufacturers are often needed to create efficiency targets that improve efficiency without sacrificing innovation. There are models of such interactions that have proven to work well (like the processes for developing Energy Star voluntary programs, many minimum efficiency standards, and industry voluntary agreements) that represent the best path forward.
References
Koomey, Jonathan, Zachary Schmidt, Bruce Nordman, Kieren Mayers, and Joshua Aslan. 2023. “Successful efficiency programs for information and communication technologies require product-specific analysis and industry/government collaboration.” Energy Efficiency. vol. 16, no. 1. 2023/01/18. pp. 2. [https://doi.org/10.1007/s12053-023-10083-y]
Pasha, Soheila. 2021. Staff Presentation: Low Power Mode Roadmap. Sacramento, CA: California Energy Commission. [https://www.energy.ca.gov/event/workshop/2021-08/staff-workshop-appliance-efficiency-roadmap-low-power-mode-data-collection]
This textbook grew out of a course my colleague Ian Monroe and I taught at Stanford in 2017 and 2018, titled “Implementing Climate Solutions at Scale”. Its intended audience is academics and practitioners teaching classes like that one, though we hope others will also find it useful.
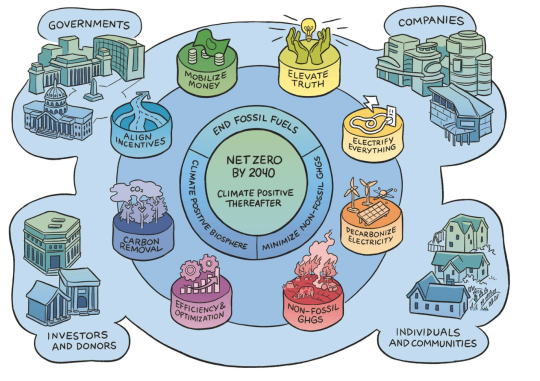
This book goes beyond our original courses to provide a more comprehensive framework for solving climate change than we’ve found elsewhere. We include an overview of climate solution technologies, as well as analytical tools necessary to identify solutions that really work. We also explore what’s needed to align incentives, mobilize money, and elevate truth in climate conversations, key pillars of climate action that are often overlooked by techno-centric discussions of global emissions reductions.
The overarching framing of the book (*the eight pillars of solving climate change”) is summarized in this graphic:
Please do reach out to me and Ian with questions, ideas for outreach, and suggestions for the next edition. You can also sign up for our mailing list by going to http://www.solveclimate.org and paging down a bit on the first page. Finally, if your institution has a library, please put in a request for them to purchase the book. It’s priced on the high side ($120), as textbooks often are, so it may be out of reach for many individuals, but libraries and companies should be able to afford it.
Our latest article on scenario decomposition tools came out in Environmental Modeling and Software in September 2022:
Koomey, Jonathan, Zachary Schmidt, Karl Hausker, and Dan Lashof. 2022. “Exploring the black box: Applying macro decomposition tools for scenario comparisons.” Environmental Modeling and Software. vol. 155, September. [https://doi.org/10.1016/j.envsoft.2022.105426]
This article is a follow on to our 2019 article in the same journal:
Koomey, Jonathan, Zachary Schmidt, Holmes Hummel, and John Weyant. 2019. “Inside the Black Box: Understanding Key Drivers of Global Emission Scenarios.” Environmental Modeling and Software. vol. 111, no. 1. January. pp. 268-281. [https://www.sciencedirect.com/science/article/pii/S1364815218300793]
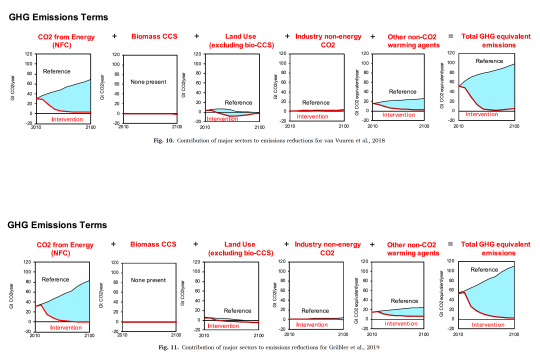
The 2022 article applies the tools developed in the 2019 article to two aggressive emissions reduction scenarios, illustrating the kinds of insights available from using these tools. We apply a Logarithmic Mean Divisia Index (LMDI) decomposition to analyze emissions reductions from the energy sector and additional tools to assess emissions reductions from other sectors.
These are the two articles containing the scenarios we compared:
Grübler, Arnulf, Charlie Wilson, Nuno Bento, Benigna Boza-Kiss, Volker Krey, David L. McCollum, Narasimha D. Rao, Keywan Riahi, Joeri Rogelj, Simon De Stercke, Jonathan Cullen, Stefan Frank, Oliver Fricko, Fei Guo, Matt Gidden, Petr Havlík, Daniel Huppmann, Gregor Kiesewetter, Peter Rafaj, Wolfgang Schoepp, and Hugo Valin. 2018. “A low energy demand scenario for meeting the 1.5 °C target and sustainable development goals without negative emission technologies.” Nature Energy. vol. 3, no. 6. 2018/06/01. pp. 515-527. [https://doi.org/10.1038/s41560-018-0172-6]
van Vuuren, Detlef P., Elke Stehfest, David E. H. J. Gernaat, Maarten van den Berg, David L. Bijl, Harmen Sytze de Boer, Vassilis Daioglou, Jonathan C. Doelman, Oreane Y. Edelenbosch, Mathijs Harmsen, Andries F. Hof, and Mariësse A. E. van Sluisveld. 2018. “Alternative pathways to the 1.5 °C target reduce the need for negative emission technologies.” Nature Climate Change. 2018/04/13. [https://doi.org/10.1038/s41558-018-0119-8]
Here’s one example of our dashboards, comparing results for two scenarios:
Regular readers know that I’ve studied the history of computing for a very long time. About four years ago (November 17, 2017) I had the good fortune to visit Bletchley Park and the UK’s National Museum of Computing, outside of London. They are contiguously located, so it was easy to visit both, and well worth the trip. I’ve been meaning to write up a brief account since the visit, and finally made the time.
Both of these museums highlight the role of mathematics and computing in the UK war effort in the late 1930s and 40s, which was only made public in the 1990s. Code breaking featured prominently, as did Alan Turing. In Bletchley Park they’ve kept some of the offices just as they were, so it’s wonderful to be in that space and imagine what it was like to work there.
Here’s a picture of Alan Turing’s office as it looks now (and looked then):
Here’s a wonderful sculpture of Turing:
This funky 1990s era website has a lot of juicy historical detail, so if you’re feeling adventurous, check it out.
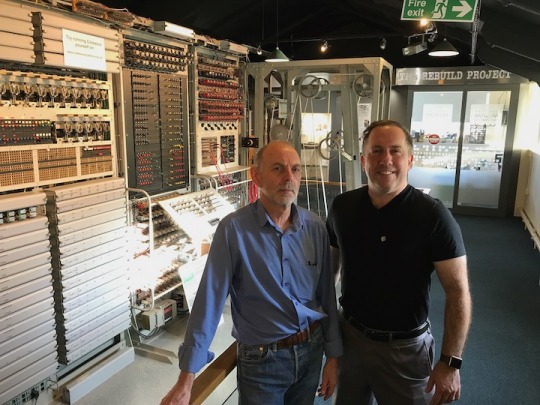
I found the recreated Colossus computer to be the highlight of the trip to the National Museum of Computing. When British Telecom (BT) started decomissioning their vacuum tube equipment in the 1980s and 1990s, some clever folks realized they could use the original design schematics for Colossus to rebuild it using the tubes from BT. The original machine is long since gone, but they made an exact replica, and it works!
It’s a special purpose computer in the purest sense. Its sole purpose was to break German Lorenz cipher. There is no clock as we understand it now, the machine is driven by a paper tape that runs in a loop. Each character is composed of 5 bits, and the machine could process 5,000 characters per second. It has 2,500 tubes, some argon filled, the rest vacuum tubes. Total power draw in operation is 8 kW.
I met Phil Hayes, the Chief Colossus Engineer, and asked him if there was any way to convert the 5,000 characters per second into something comparable to “instructions per second” or another more modern unit of performance. Phil was pretty sure that wasn’t possible, due to the specialized nature of the tasks performed by this computer.
Here’s a photo of me with Phil in front of Colossus:
Click on the link below to download a video of Colossus in operation (the sounds are great!). It’s a big file (46 MB) but worth the download:
If you are interested in the history of computing and are in and around London, by all means take the trip to Milton Keynes and check out these two world class museums.
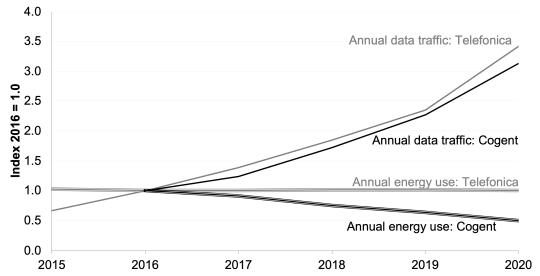
I and Professor Eric Masanet of UC Santa Barbara have a new commentary article out today in the refereed journal Joule. It explores four common pitfalls that cause researchers and commentators to exaggerate information technology electricity use and emissions, and suggests four ways industry and researchers can avoid spreading such misconceptions in the future.
It’s a short article, so I won’t spoil it by giving too much away, but the figure above summarizes one key lesson from our review: Growth in data traffic in either the short term or the long term does not necessarily imply growth in energy use. It depends on how fast efficiency improves!
My keynote talk today for the iTherm 2021 technical conference is an expansion of points made in a commentary article by me and Professor Eric Masanet, UCSB, which is “in press” at Joule right now (more when that’s published). I presented nine different high-profile misconceptions about electricity use and emissions associated with computing, explored four pitfalls that lead to such misconceptions, and suggested four ways we can do better in the future.
Here is the conclusions slide:
You can download a PDF of the slides (which include three pages of references) HERE.
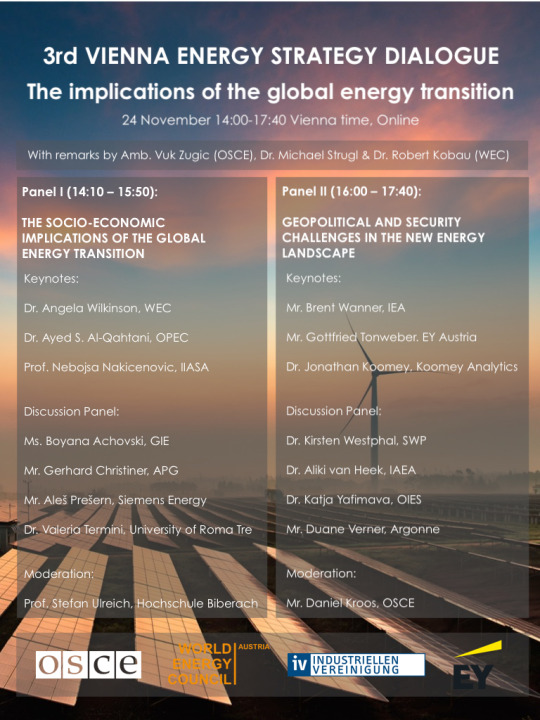
My talk was titled “Information and communications technology (ICT) and the energy/climate transition”, and I presented it today (November 24, 2020) at the 3rd Vienna Energy Strategy Dialogue, on the Implications of the Global Energy Transition”, Vienna, Austria.
The key points:
• Direct electricity used by ICT is modest and hasn’t grown much if at all in recent years.
• Nobody can credibly project ICT electricity use more than a few years ahead, and exaggerations of ICT electricity use abound in the literature.
• ICT is a powerful source of emissions reductions throughout the economy, which is why I call ICT our “ace in the hole” when it comes to facing the climate challenge.