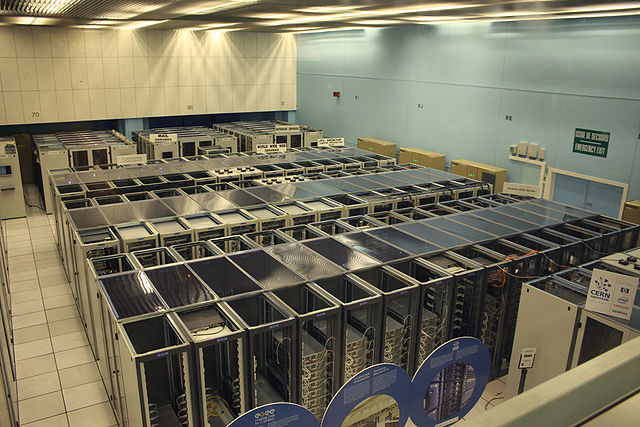
Cern datacenter Photo credit: By Hugovanmeijeren (Own work) [GFDL or CC-BY-SA-3.0-2.5-2.0-1.0], via Wikimedia Commons
I’ve been struggling for years to convince executives in large enterprises to fix the incentive, reporting, and other structural problems in data centers. The folks in the data center know that there are issues (like having separate budgets for IT and facilities) but fixing those problems is “above their pay grade”. That’s why we’ve been studying the clever things eBay has done to change their organization to take maximal advantage of IT, as summarized in this case study from 2013:
That’s also why I’ve worked with Heatspring to develop the following online course, the latest version of which starts September 26th and goes through November 6th, 2016:
This is a unique opportunity to spend six weeks learning from Jonathan Koomey, a Research Fellow at the Steyer-Taylor Center for Energy Policy and Finance at Stanford University, and one of the foremost international experts on data center energy use, efficiency, organization, and management.
This course provides a road map for managers, directors, and senior directors in Technology Business Management (TBM), drawing upon real-world experiences from industry-leading companies like eBay and Google. The course is designed to help transform enterprise IT into a cost-reducing profit center by mapping the costs and performance of IT in terms of business KPIs.
Executives in this course will gain access to templates and best practices used by leaders in your data center. You’ll use these templates to complete a Capstone Project, in which you will propose management changes for your organization to help increase business agility, reduce costs, and move their internal IT organization from being a cost center to a cost-reducing profit center.
I’m excited about this class, but we need more signups. Please spread the word!
I’ve now developed an introductory class (in collaboration with Heatspring) specifically targeted to VP and C level executives who want to transform their data centers into cost reducing profit centers. It’s called Data Center Essentials for Executives–A Beginner’s Guide. For a modest investment of time (about 1.5 hours in total) this short course offers a high level summary of steps every company can take to improve the business performance of its IT organization.
Students can sign up at any time and take the class whenever is convenient. I encourage those who sign up to reach out to me via email with specific questions.
This June, we published a big story—Shane Bauer’s account of his four-month stint as a guard in a private prison. That’s “big,” as in XXL: 35,000 words long, or 5 to 10 times the length of a typical feature, plus charts, graphs, and companion pieces, not to mention six videos and a radio documentary.
It was also big in impact. More than a million people read it, defying everything we’re told about the attention span of online audiences; tens of thousands shared it on social media. The Washington Post, CNN, and NPR’s Weekend Edition picked it up. Montel Williams went on a Twitter tear that ended with him nominating Shane for a Pulitzer Prize (though that’s not quite how it works). People got in touch to tell us about their loved ones’ time in prison or their own experience working as guards. Lawmakers and regulators reached out. (UPDATE: And on August 18, the Justice Department announced that it will no longer contract with private prisons, which currently hold thousands of federal inmates—a massive policy shift.)
In the wake of our investigation, lots of people offered thoughts similar to this, from New Yorker TV critic Emily Nussbaum:
Incidentally,that Shane Bauer Mother Jones undercover investigation is literally why journalism exists and why we have to pay for it.
That’s a great sentiment, and we agree! But it also takes us to a deeper story about journalism and today’s media landscape. It starts with this: The most important ingredient in investigative reporting is not brilliance, writing flair, or deep familiarity with the subject (though those all help). It’s something much simpler—time.
And of course, time is money! Here’s the key takeaway:
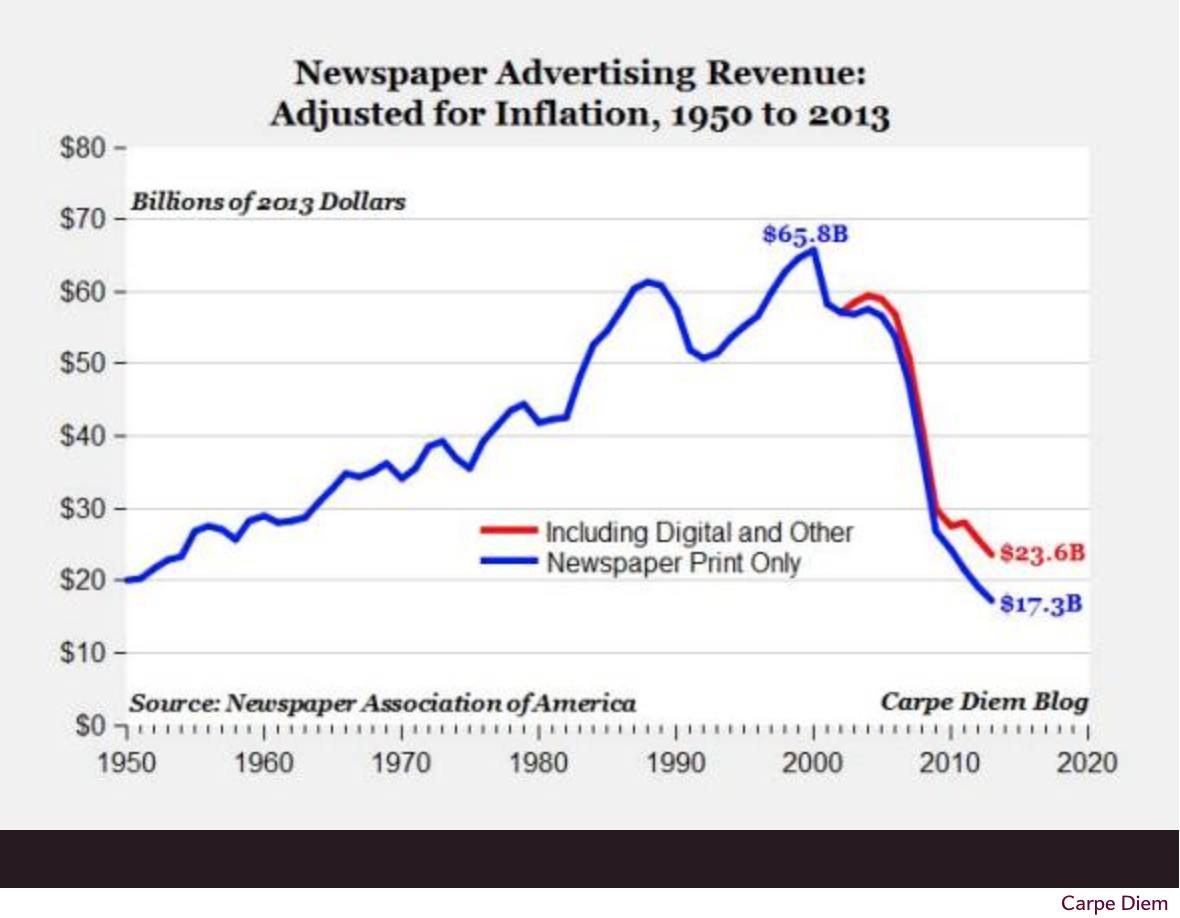
Conservatively, our prison story cost roughly $350,000. The banner ads that appeared in it brought in $5,000, give or take.
I had a wide ranging conversation with Chris Nelder that he recorded for his Energy Transitions podcast series, posted today. We covered a lot of ground, as the description reveals:
Should we tweak our markets to keep nuclear plants alive, or forget about markets and pay for them another way… and do we really need them at all to keep the grid functioning? Is nuclear power really declining because of overzealous environmentalists, or are there other reasons? Is it possible to balance a grid with a high amount of variable renewables and no traditional baseload plants? Is cost-benefit analysis the right way to approach energy transition? How much “decoupling” can we do between the economy and energy consumption, and how can we correctly measure it? Why are we so bad at forecasting energy and economic growth, and how can we do it better? How will energy transition affect the economy?
Good thing I came up for air in between topics! I enjoyed chatting with Chris–I always learn something from him. And I can chalk up this opportunity to Twitter, because I met him through our Twitter interactions.
1. Greenhouse gases were the highest on record. 2. Global surface temperature was the highest on record. 3. Sea surface temperature was the highest on record. 4. Global upper ocean heat content highest on record. 5. Global sea level rose to a new record high in 2015. 6. Tropical cyclones were well above average, overall. 7. The Arctic continued to warm; sea ice extent remained low.
If anyone still has any doubt that the earth is warming and humans are responsible, they should read this document!
Lawrence Berkeley National Laboratory, in collaboration with experts at Stanford (me), Carnegie Mellon, and Northwestern, today released our latest analysis of electricity used by data centers in the US. Surprisingly, electricity use in data centers has been roughly flat since the financial crisis with little growth projected to 2020, even though delivery of computing services has been increasing rapidly. As I’ve argued for years, the level of inefficiency in enterprise data center facilities leaves lots of room for improvement, and the market is finally getting that message.
Here are the first couple of paragraphs of the executive summary:
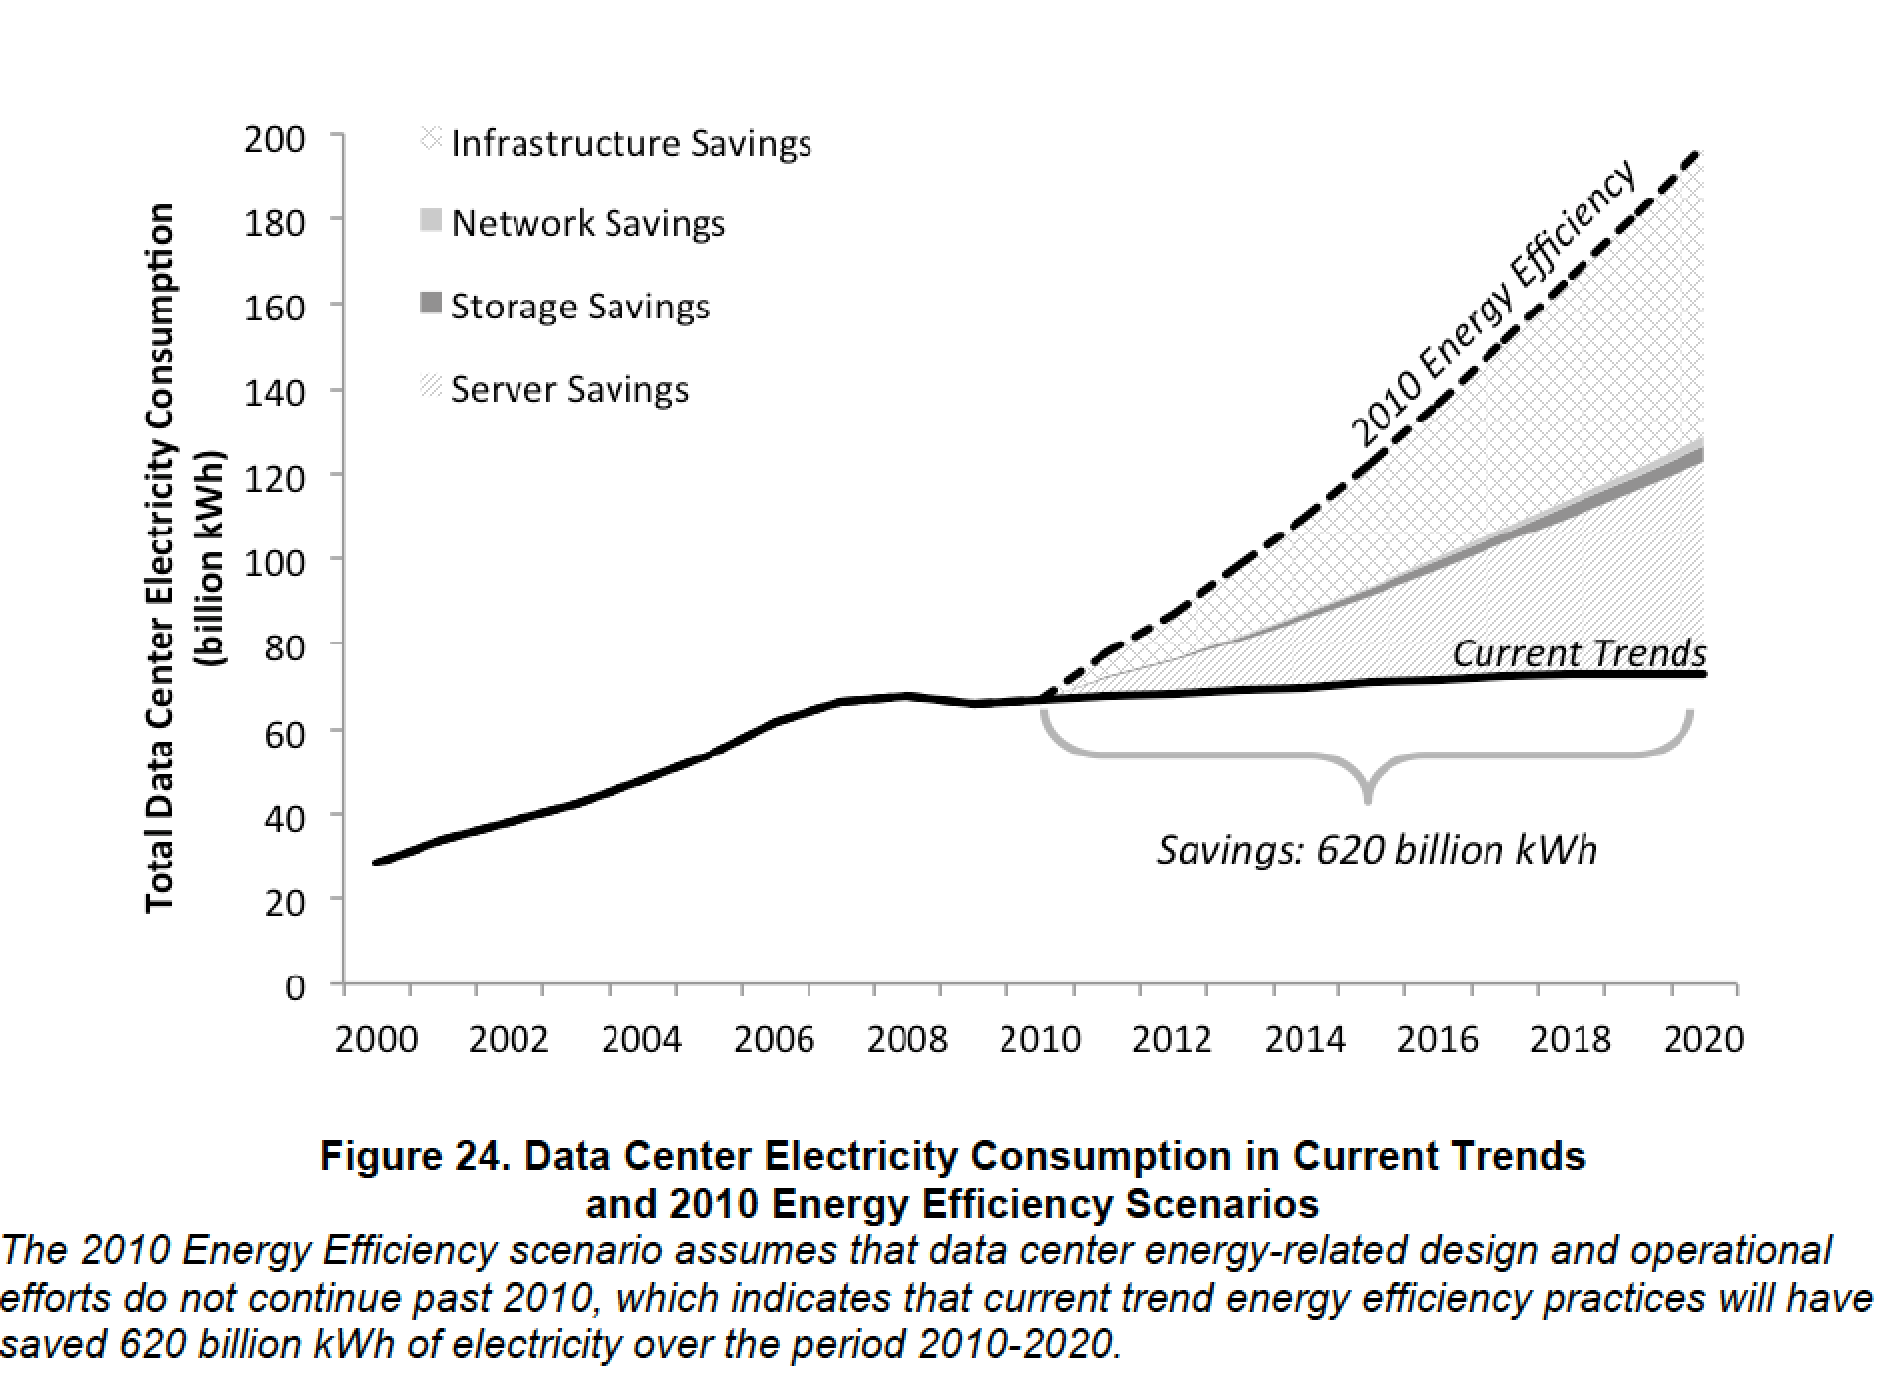
This report estimates historical data center electricity consumption back to 2000, relying on previous studies and historical shipment data, and forecasts consumption out to 2020 based on new trends and the most recent data available. Figure ES-1 provides an estimate of total U.S. data center electricity use (servers, storage, network equipment, and infrastructure) from 2000-2020. In 2014, data centers in the U.S. consumed an estimated 70 billion kWh, representing about 1.8% of total U.S. electricity consumption. Current study results show data center electricity consumption increased by about 4% from 2010-2014, a large shift from the 24% percent increase estimated from 2005-2010 and the nearly 90% increase estimated from 2000-2005. Energy use is expected to continue slightly increasing in the near future, increasing 4% from 2014-2020, the same rate as the past five years. Based on current trend estimates, U.S. data centers are projected to consume approximately 73 billion kWh in 2020.
Many factors contribute to the overall energy trends found in this report, though the most conspicuous change may be the reduced growth in the number of servers operating in data centers. While shipments of new servers into data centers continue to grow every year, the growth rate has diminished over the past 15 years. From 2000-2005, server shipments increased by 15% each year resulting in a near doubling of servers operating in data centers. From 2005-2010, the annual shipment increase fell to 5%, partially driven by a conspicuous drop in 2009 shipments (most likely from the economic recession), as well as from the emergence of server virtualization across that 5-year period. The annual growth in server shipments further dropped after 2010 to 3% and that growth rate is now expected to continue through 2020. This 3% annual growth rate coincides with the rise in very large “hyperscale” data centers and an increased popularity of moving previously localized data center activity to colocation or cloud facilities. In fact, nearly all server shipment growth since 2010 occurred in servers destined for large hyperscale data centers, where servers are often configured for maximum productivity and operated at high utilization rates, resulting in fewer servers needed in the hyperscale data centers than would be required to provide the same services in traditional, smaller, data centers.
Here’s the full reference:
Shehabi, Arman, Sarah Smith, Dale A. Sartor, Richard E. Brown, Magnus Herrlin, Jonathan G. Koomey, Eric R. Masanet, Nathaniel Horner, Inês Lima Azevedo, and William Lintner. 2016. United States Data Center Energy Usage Report. Berkeley, CA: Lawrence Berkeley National Laboratory. LBNL-1005775. June 27. [http://eta.lbl.gov/publications/united-states-data-center-energy-usag]
“Impossible is just a big word thrown around by small men who find it easier to live in the world they’ve been given than to explore the power they have to change it. Impossible is not a fact. It’s an opinion. Impossible is not a declaration. It’s a dare. Impossible is potential. Impossible is temporary. Impossible is nothing.”
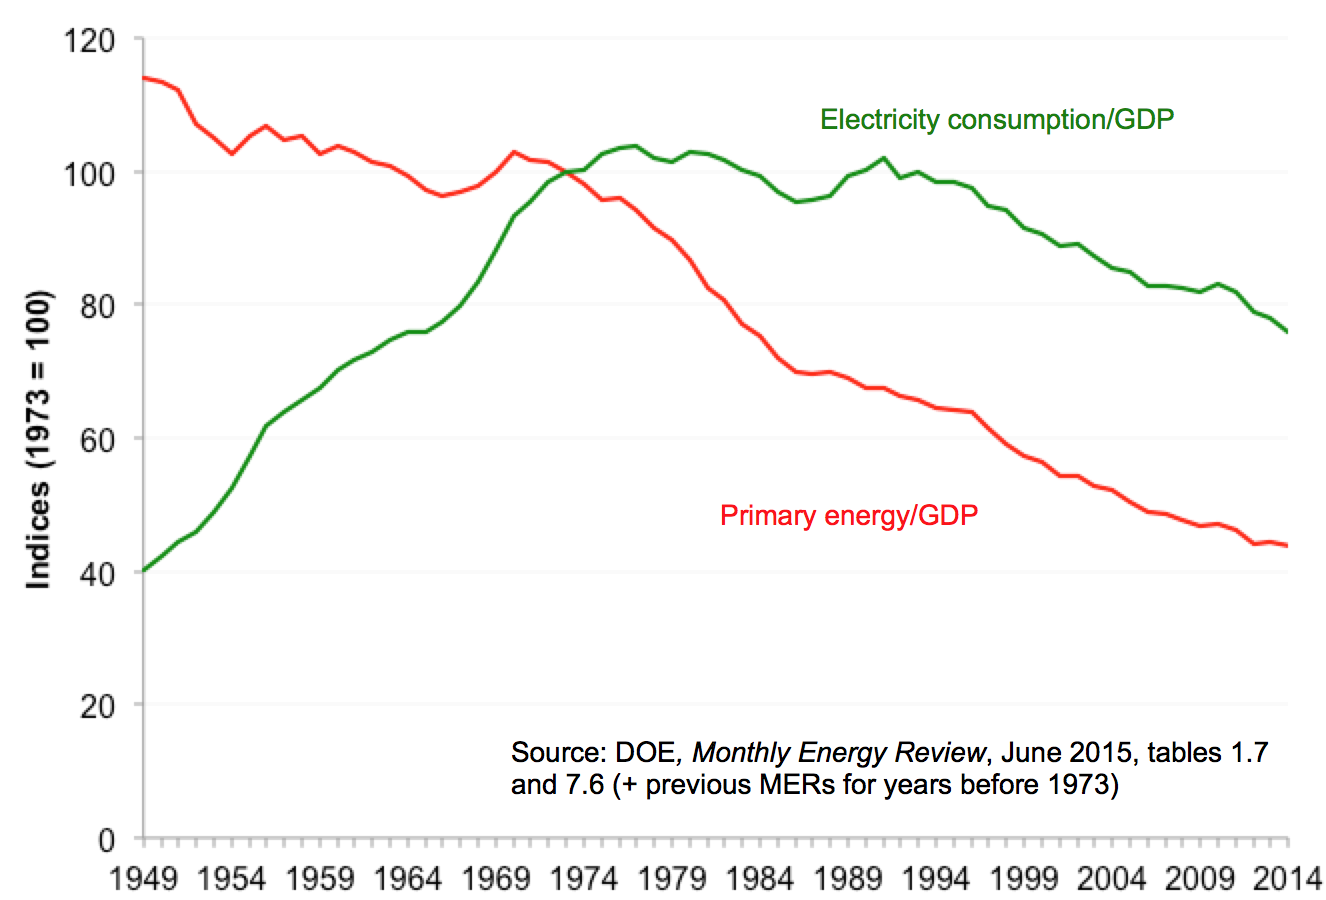
Graph of energy and electricity/GDP indices taken from Hirsh and Koomey 2015 (subscription required). The graphs illustrate structural changes in the relationship between energy and economic activity that have confounded modelers in the past and will no doubt do so in the future.
This webinar explores why (with few exceptions) models of economic systems do not yield accurate predictions about the future. Predictions can be accurate when systems have consistent structure (geographically and temporally) and when there are no surprises, but neither of these conditions holds for virtually all economic systems. Physical systems can exhibit structural constancy, so predictions based on physical sciences can be accurate (barring surprises). The webinar also explores implications of this irreducible uncertainty, introduces ways to cope with it, and discusses responsible use of economic modeling tools in the face of such modeling limitations. The talk explores these issues using examples of forecasts of US primary energy use, oil prices, electricity demand, and the costs of nuclear power.
Addendum, June 1, 2016: Some of the participants in the workshop wanted to understand why economic modelers have a hard time accepting the thesis of my talk. I pointed them to a November 30, 2014 NYT blog post by Paul Krugman about the sociology of economics that is revealing. The Krugman post refers to a study that will be fascinating for anyone interested in how the economic community operates.
Here are the opening paragraphs of the DCD article:
Twenty first century data centers are the crown jewels of global business. No modern company can run without them, and they deliver business value vastly exceeding their costs. The big hyperscale computing companies (like Google, Microsoft, Amazon, and Facebook) are the best in the industry at extracting that business value, but for many enterprises whose primary business is not computing, the story is more complicated.
If you work in such a company, you know that data centers are often strikingly inefficient. While they may still be profitable, their performance still falls far short of what is possible. And by “far short” I don’t mean by 10 or 20 percent, I mean by a factor of ten or more.
The course will teach people how to bring their data centers into the twenty first century, turning them from cost centers into cost-reducing profit centers.
Our article critiquing the recent Lovering et al. Energy Policy article on the costs of nuclear power was just published online by Energy Policy (the article is now considered to be “in press” with only minor tweaks to come once they assign the article to an issue). My colleagues Nate Hultman at the University of Maryland and Arnulf Grubler of Yale University and the International Institute of Applied Systems Analysis teamed up with me on the critique.
Here’s the abstract:
Lovering et al. (2016) present data on the overnight costs of more than half of nuclear reactors built worldwide since the beginning of the nuclear age. The authors claim that this consolidated data set offers more accurate insights than previous country-level assessments. Unfortunately, the authors make analytical choices that mask nuclear power’s real construction costs, cherry pick data, and include misleading data on early experimental and demonstration reactors. For those reasons, serious students of such issues should look elsewhere for guidance about understanding the true costs of nuclear power.
Here are the references for the relevant articles:
Koomey, Jonathan, Nathan E. Hultman, and Arnulf Grubler. 2016. “A reply to "Historical construction costs of global nuclear power reactors”.“ Energy Policy. April. [http://dx.doi.org/10.1016/j.enpol.2016.03.052]
Alex Gilbert, Ben Sovacool, Phil Johnstone, and Andy Stirling also did a critique of Lovering et al. that should appear in the same issue (it’s also “in press”):
Gilbert, Alexander, Benjamin K. Sovacool, Phil Johnstone, and Andy Stirling. “Cost overruns and financial risk in the construction of nuclear power reactors: A critical appraisal.” Energy Policy. [http://www.sciencedirect.com/science/article/pii/S0301421516301690]
Our understanding was that the editor sought out a response to our critiques from Lovering et al, but we don’t know when that one will appear. We were told initially that it would appear at the same time as our articles.
Please email me if you’d like a copy of our article, or download directly if you have access through your university.
Cern datacenter Photo credit: By Hugovanmeijeren (Own work) [GFDL or CC-BY-SA-3.0-2.5-2.0-1.0], via Wikimedia Commons
I’ve been struggling for years to convince executives in large enterprises to fix the incentive, reporting, and other structural problems in data centers. The folks in the data center know that there are issues (like having separate budgets for IT and facilities) but fixing those problems is “above their pay grade”. That’s why we’ve been studying the clever things eBay has done to change their organization to take maximal advantage of IT, as summarized in this case study from 2013:
Schuetz, Nicole, Anna Kovaleva, and Jonathan Koomey. 2013. eBay: A Case Study of Organizational Change Underlying Technical Infrastructure Optimization. Stanford, CA: Steyer-Taylor Center for Energy Policy and Finance, Stanford University. September 26.
That’s also why I’ve worked with Heatspring to develop the following online course, the third instance of which starts May 2nd and goes through June 12th, 2016:
This is a unique opportunity to spend six weeks learning from Jonathan Koomey, a Research Fellow at the Steyer-Taylor Center for Energy Policy and Finance at Stanford University, and one of the foremost international experts on data center energy use, efficiency, organization, and management.
This course provides a road map for managers, directors, and senior directors in Technology Business Management (TBM), drawing upon real-world experiences from industry-leading companies like eBay and Google. The course is designed to help transform enterprise IT into a cost-reducing profit center by mapping the costs and performance of IT in terms of business KPIs.
Executives in this course will gain access to templates and best practices used by leaders in your data center. You’ll use these templates to complete a Capstone Project, in which you will propose management changes for your organization to help increase business agility, reduce costs, and move their internal IT organization from being a cost center to a cost-reducing profit center.
I’m excited about this class, but we need more signups by early May. Please spread the word by sending this blog post to upper level management in the company where you work.
CC BY-SA 3.0 File:Bouncing ball strobe edit.jpg Created: 29 September 2007
More excuses from the Breakthrough Institute on data quality
Dr. Harry Saunders, a Senior Fellow at the Breakthrough Institute, has responded to our criticism of his work on the rebound effect. For completeness we will address some new issues he has raised, but at this point our exchange has thoroughly covered the disputed territory. We stand by our concerns and encourage interested readers to review the published journal articles (Saunders, 2013; Cullenward and Koomey, 2016), our original summary post, our response to initial Breakthrough Institute comments at our website and on social media, and Dr. Saunders’ new essay.
Too little, too late
Considering the significant errors we identified in Dr. Saunders’ published article, his latest reaction is a remarkable exercise in deflection. As described in our original post, we have clearly demonstrated that his data did not match his methods:
Dr. Saunders’ data actually concern national average prices, not the sector- and location-specific marginal prices that energy economists agree are necessary to evaluate the rebound effect. The distinction is most important because actual energy prices vary widely by sector and location; in addition, economic theory asserts that changes in the marginal (not the average) price of energy services cause the rebound effect. As a result, Dr. Saunders’ findings of high rebound and backfire are wholly without support.
Despite acknowledging these significant methodological inconsistencies, Dr. Saunders continues to insist they do not matter and that the burden is on his critics to show that his results are invalid. While he is free to make the case for why the mistakes we identified don’t affect his results, it’s worth reminding readers that this is a discussion we should have been having five years ago—and certainly by the time Dr. Saunders published his 2013 article, which entirely ignored the concerns we had already raised with him.
The problems we identify call for far more than an additional caveat in Dr. Saunders’ work because they show his study lacks a valid empirical basis. This episode also counsels serious skepticism of rebound-related research from the Breakthrough Institute, which breathlessly promoted Dr. Saunders’ work as a “detailed econometric analysis” and “rigorous new methodology”;[1]“an important contribution to the study of rebound effects that fills a key void in analyses of rebound for producing sectors of the economy”;[2] a “fruitful path for further examination of rebound effects”;[3]; and the very essence of intellectual modesty, with an “extensive discussion”[4] of cautions and limitations that “are rigorously illuminated by the author.”[5]
Yet when confronted with serious concerns about the empirical basis of the study—both privately within the expert community five years ago and publicly again this year—Dr. Saunders and his colleagues at the Breakthrough Institute doubled down on aggressive and unsubstantiated findings that fit their political narrative on rebound, not the facts.
A cursory look at the wrong data
Instead of acknowledging serious analytical errors, Dr. Saunders defends his results by asserting that there is no difference, econometrically speaking, between changes in national and state-level average energy prices. According to Dr. Saunders, there is no difference in the variation of prices observed at the state and national levels. Therefore, he claims his published results are unaffected by using national average prices in a model that estimates industry-specific rebound effects. He makes his case by analyzing EIA fuel price data for California, Texas, and the United States.
This effort falls well short of excusing his paper’s mistakes.
First of all, analyzing EIA price data doesn’t tell us anything about the validity of Dr. Saunders’ 2013 article because he used a completely different data set in that study. Again, Dr. Saunders’ paper relied on a data set from Professor Jorgenson, which, as we have repeatedly pointed out, is inconsistent with EIA’s more reliable data in the few instances where the categorization of the two data sets is even roughly comparable. On top of that, the Jorgenson data are explicitly constructed from non-EIA data sources. So how do patterns in the EIA data support Dr. Saunders’ approach?
Second, Dr. Saunders once again avoids confronting his model’s complete lack of primary data. Comparing state and national prices does not speak to the difference between national prices and the industry-specific prices Dr. Saunders incorrectly claimed his data provide. While it would be nice to see the difference the use of correct data would make, there are no primary energy price data at the level of Professor Jorgenson’s industrial classifications, which approximate—but only roughly—the 2-digit SIC classification scheme.[6]
The lack of data reflects the fact that five energy-producing sectors in Professor Jorgenson’s data do not correspond well to real-world energy markets. For example, the data have a combined oil and gas extraction sector, which is assigned a single national price; however, the relationship between oil and natural gas prices in North American energy markets is far more complex than a single composite price index could reasonably represent over nearly five decades. Section 9 in our published article’s Supplemental Information reviews this and several related concerns in detail.
Third, Dr. Saunders makes a very limited case that EIA data show little difference in energy price variation at the state and national levels. For one thing, he presents detailed data for only two states, not fifty.[7] Perhaps more importantly, he compares trends across incongruous time periods. His published article runs a model over 45 years of data (1960-2005), but in his blog post, Dr. Saunders compares state and national data across different time periods for natural gas (1967-2014), distillate fuel oil (1983-2010), residual fuel oil (1983-2010), and electricity (1990-2014). This is hardly a firm basis for establishing a fixed relationship between price trends over a much longer period; and it is all the more problematic because the statistical match he reports is actually quite poor for electricity, a key fuel for price-sensitive, energy-intensive industries that have historically been located in areas with distinct electricity fuel mixes (e.g., hydropower in the Pacific Northwest or coal in the Rust Belt).
Finally, Dr. Saunders glosses over the significant problem of using average prices to study the rebound effect. He acknowledges that “[i]n a microeconomic sense, it is true that producer decisions depend on marginal prices rather than average prices.” But he claims his paper’s reliance on average price data is acceptable because his econometric model takes as input the change in prices, not absolute prices. Implicit in this claim is the rather bold assertion that variation in marginal and average prices are statistically equivalent—a proposition without any support whatsoever in either his blog post or paper. By using average prices, Dr. Saunders rejects the standard approach in microeconomics and thereby fails to distinguish between rebound effects and all other behavioral responses to energy prices.
As a result, Dr. Saunders’ response fails to address the data quality concerns we raised in our paper.
Garbage in, garbage out
Then there is the question of the theoretical validity of Dr. Saunders’ model, a topic our response article explicitly did not address (see footnote 6 on page 206 of our published paper). Dr. Saunders mistakes our silence as evidence that his model is unassailable:
In many ways, the Cullenward/Koomey critique of the Saunders article is reassuring. They have plainly taken a deep look at the analysis and, finding no methodological issues to criticize, were reduced to challenging the Jorgenson et al. dataset used in the rebound analysis.
Dr. Saunders finds a strange comfort in our criticism. We focused on data quality not for lack of other concerns, but because we are experts in U.S. energy data and knew from unrelated research projects that no primary data sources could support the paper’s analysis. If that isn’t a methodological criticism, we don’t know what is.
We were careful not to cast aspersions in our response article on those aspects of Dr. Saunders’ work we did not analyze in detail, including his model structure. Nevertheless, we aren’t convinced that his model is any more accurate than his data and reject the notion that our silence implies a failure (or even an interest) in finding problems with his model.
If anything, the errors we found in Dr. Saunders’ data suggest that those who examine his model will find problems there, too. But we need not address that issue because the inconsistencies we found in Dr. Saunders’ data are sufficiently grave to invalidate his conclusions. The first question any good analyst asks is whether the data can speak to the research question at hand. If they can’t, the details of model structure are irrelevant.
Hide-and-seek in peer review
Finally, we note that Dr. Saunders places great reliance on the fact that his 2013 article made it through peer review:
Cullenwald [sic] and Koomey simply complain that they raised concerns about problems with my data set at a Carnegie Mellon workshop in 2011. This is indeed the case. I subsequently published my analysis, and it passed peer-reviewed muster, because … there is no evidence that those concerns are particularly material to the conclusions of my analysis.
Unfortunately, the quality control mechanisms of peer review should give readers little comfort in this instance. Dr. Saunders did not disclose any data quality issues to reviewers, who were ill equipped to assess the issue as a result.
We are grateful that the journal Technological Forecasting & Social Change, which published Dr. Saunders’ 2013 paper, was also willing to publish our response article. With respect, however, TF&SC is not primarily an economics journal. For example, one of our anonymous reviewers requested we explicitly define commonly understood economics terms (such as the principal-agent problem) in order to better communicate with the journal’s readers, not all of whom are familiar with standard economic jargon.
It is hard for us to imagine that peer reviewers at an interdisciplinary journal with limited readership among economists would have been able to identify the detailed data concerns we raised with Dr. Saunders in 2011 but which he did not disclose in his submission. As our response article demonstrates, his published paper fundamentally misconstrues the nature of its own data sources—an inconsistency a peer reviewer would only discover if he or she took the exceptional effort to read the references listed in Professor Jorgenson’s data documentation, not merely Dr. Saunders’ factually incorrect description of his own methodology.
Presumably Dr. Saunders had not yet realized these mistakes when he submitted his paper to the journal, in which case he has absolutely no business citing peer review as validation on this point. But this benign interpretation makes sense only if Dr. Saunders completely discounted our warning that no primary data existed at the level of specificity his model required (as one of us (D.C.) presented at a Carnegie Mellon University workshop Dr. Saunders attended in July 2011, and as both of discussed over lunch with Dr. Saunders and his colleague Jessie Jenkins in March 2011).
Alternatively, if at the time of journal submission Dr. Saunders knew (or reasonably suspected) his data didn’t match his model, it appears he withheld critical information from peer reviewers and misled the research community. Given the importance of the timing of Dr. Saunders’ realization, we would be grateful if he would clarify exactly when he realized that his data actually represent national averages, not industry-specific marginal prices.[8]
In light of the methodological inconsistencies we documented in Dr. Saunders’ work, we think the journal made the right decision to publish our peer-reviewed response article. To the extent Dr. Saunders believes the errors we documented don’t change his results, we would encourage him to make a full and complete rebuttal in the peer-reviewed economics literature.
[6] As many economists know, the federal government stopped using SIC accounting in the late 1990s. It turns out that Professor Jorgenson never bridged the SIC and newer NAICS accounting structures, and therefore had to extrapolate the last five years of his KLEMS data because no government entity publishes data in the SIC structure he retained. See Cullenward and Koomey (2016), supplemental information at Section 7.
[7] Dr. Saunders also presents a graph of commercial natural gas price data for eight states and concludes that the visual pattern of variation across these states is comparable to variation in the national average price.
[8] While Dr. Saunders explicitly (and incorrectly) claimed to be using industry-specific energy prices, his paper never specified whether these were average or marginal prices. It is entirely possible that Dr. Saunders intentionally (as opposed to mistakenly) used average prices. Whatever the case, we believe the paper should been explicit about its departure from the standard approach in microeconomics.
My friend Fred Stein at SRI alerted me to this upcoming event. I’m not able to make it, but I encourage others to attend. If you do go, please let me know what you learned!
Silicon Valley is driving how corporations operate and manage their commercial real estate more effectively using automation to make buildings smarter. As companies like Google, Apple, Facebook, and LinkedIn expand their campuses, and small companies continue to grow, their need to accommodate employees increases. Smart Building technology using the Internet of Things and data analytics is allowing these companies to design and operate intelligent work environments that allow occupants as well as property managers to work more efficiently and minimize operation costs.
Innovators in corporate real estate and building automation are working alongside Silicon Valley’s entrepreneurs vying for a position in a market that is expected to grow by $200B by 2020. How will the rise of these data-driven, intelligent buildings change the occupant experience? What data is being collected and put to use? What will change in building management? How many jobs will be affected?
Join us for an engaging panel discussion on February 16, 2016.
Moderator: Jim Young, Co-Founder & CEO, Realcomm
Panelists: Andrew Krioukov, Co-Founder & CEO, Building Robotics Vladi Shunturov, Co-Founder & President, Lucid Design Group Q Motiwala, Managing Director, Draper Nexus
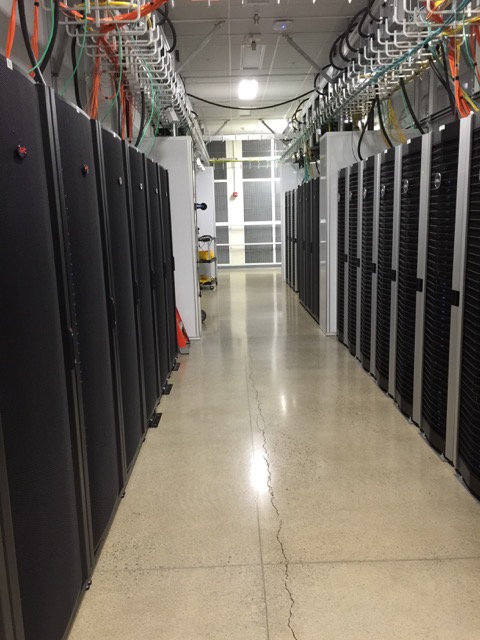
Modern enterprise data centers are some of the most technically sophisticated business activities on earth. Ironically enough, they are also often bastions of inefficiency, with equipment utilization much below ten percent and 30 percent of the servers in those facilities being comatose (using electricity but performing no useful information services). The operators of these facilities also struggle to keep pace with rapid changes in deployments of computing equipment.
These problems have led to much attention being paid to improving data center management. While almost every enterprise data center has taken steps to improve its operations, virtually all are much less efficient, much more costly, and far less flexible than they could be. Those failings ultimately prevent data centers from delivering maximum business value to the companies that own them.
Well-managed data centers use what I call the three pillars of modern data center operations: tracking, procedures, and physical principles…


