Cern datacenter Photo credit: By Hugovanmeijeren (Own work) [GFDL or CC-BY-SA-3.0-2.5-2.0-1.0], via Wikimedia Commons
I’ve been struggling for years to convince executives in large enterprises to fix the incentive, reporting, and other structural problems in data centers. The folks in the data center know that there are issues (like having separate budgets for IT and facilities) but fixing those problems is “above their pay grade”. That’s why we’ve been studying the clever things eBay has done to change their organization to take maximal advantage of IT, as summarized in this case study from 2013:
Schuetz, Nicole, Anna Kovaleva, and Jonathan Koomey. 2013. eBay: A Case Study of Organizational Change Underlying Technical Infrastructure Optimization. Stanford, CA: Steyer-Taylor Center for Energy Policy and Finance, Stanford University. September 26.
That’s also why I’ve worked with Heatspring to develop the following online course, the third instance of which starts May 2nd and goes through June 12th, 2016:
This is a unique opportunity to spend six weeks learning from Jonathan Koomey, a Research Fellow at the Steyer-Taylor Center for Energy Policy and Finance at Stanford University, and one of the foremost international experts on data center energy use, efficiency, organization, and management.
This course provides a road map for managers, directors, and senior directors in Technology Business Management (TBM), drawing upon real-world experiences from industry-leading companies like eBay and Google. The course is designed to help transform enterprise IT into a cost-reducing profit center by mapping the costs and performance of IT in terms of business KPIs.
Executives in this course will gain access to templates and best practices used by leaders in your data center. You’ll use these templates to complete a Capstone Project, in which you will propose management changes for your organization to help increase business agility, reduce costs, and move their internal IT organization from being a cost center to a cost-reducing profit center.
I’m excited about this class, but we need more signups by early May. Please spread the word by sending this blog post to upper level management in the company where you work.
The reports produced by the Intergovernmental Panel on Climate Change contain the sum total of scientific knowledge on climate change science, mitigation, and adaptation. The long lead times needed to produce such comprehensive documents means that they inevitably omit the latest scientific findings when the reports are finally approved and published, but those reports are still a treasure trove for researchers working on most aspects of climate science and solutions.
What are great resources for researchers, however, are not necessarily accessible for the intelligent lay reader. For that much broader audience there is the excellent compilation of the IPCC’s findings from Professors Michael E. Mann and Lee R. Kump of Pennsylvania State University. The book, titled Dire Predictions: Understanding Climate Change—the Visual Guide to the Findings of the IPCC, is now out in its second edition.
A real strength of this book is that the authors distill what’s important, so you don’t have to. The book is visual, as the title implies. It has pictures on every page, and is chock full of key graphs from the IPCC reports. The prose is clear and concise, and is written for a Scientific American level audience (i.e., lay readers who take an intelligent interest in science and who are not scared off by graphs). If graphs aren’t your thing, you can still learn a great deal by just reading the text.
The structure of the book is very close to the 1stedition, with five major sections:
Part 1: Climate Change Basics
Part 2: Climate Change Projections
Part 3: The Impacts of Climate Change
Part 4: Vulnerability and Adaptation to Climate Change
Part 5: Solving Climate change
In each section you’ll find short (1-3 page) sections covering each key topic, so it’s relatively easy going. The 2nd edition contains 16 more pages than the 1st edition, and that new material highlights findings that have become more salient in recent years. Those new topics include:
Where is all that heat going?
Suffocating the ocean
Welcome to the Anthropocene
The 2012 North American heat wave
Comparing climate model predictions with observations
How sensitive is the climate?
Fossil-fuel emissions scenarios
The “faux pause”
Past IPCC projections: How did they do?
Tipping points, irreversibilities, and abrupt climate change
It’s all about the economy
The water-energy nexus
Dire Predictions is a wonderful summary of climate science for the lay reader, and I highly recommend it. If you pair it with Joe Romm’s Climate Change: What Everyone Needs to Know (which is equally readable and contains more extensive treatment of climate economics, policy, and solutions) you’ll have complete and up to date knowledge of climate change and what we can do about it. Both books together would work well as the basis for high school, college, and graduate level classes, or as the core resources for reading clubs exploring climate change. If you care about climate, these books are “best in class”.
Last Monday (January 4th, 2016), we published a postsummarizing the implications of our critique of Harry Saunders’ article on rebound effects in the US economy. We have since received thoughtful comments from Dr. Saunders (a Senior Fellow at the Breakthrough Institute (BTI)), Jesse Jenkins (a PhD student at MIT and lead author of the 2011 Breakthrough Institute rebound report that relied on Saunders’ article), and Steve Sorrell (Professor at the University of Sussex and a BTI Senior Fellow*).
Here, we address the main objections our critics have raised. We pay special attention to Professor Sorrell’s comments because they have been endorsed by Mr. Jenkins, BTI Chairman Ted Nordhaus, and BTI co-founder and Senior Fellow Michael Shellenberger.
To begin, we note that none of our critics have disputed our core finding: that Dr. Saunders’ analysis relied on national average energy prices, not the sector-specific prices he claimed his data represented. In addition, Dr. Saunders used average annual price data, whereas economists generally prefer marginal prices to properly isolate the rebound effect from unrelated behavioral and energy market-induced changes.
Given the nearly five years it took to prompt a discussion about Dr. Saunders’ evidence, including long conversations over email and in person, the silence on this point is notable. Nevertheless, we take it as a sign that all sides agree on these critical observations, which (as we pointed out in our response paper) have always been confirmable both directly in the data in question and its documentation. There are many more problems to work through, of course, but this is a productive start.
Having at least acknowledged some deficiency in Dr. Saunders’ analysis, then, our critics either implicitly distance their policy positions on the rebound effect from Dr. Saunders’ article and/or defend the econometric analysis of energy price data we have shown to be woefully inadequate. Below, we review these arguments and offer some responses.
Argument 1: Don’t Let the Perfect Be the Enemy of the Good
Scientists don’t always have perfect data and sometimes they need to make assumptions about missing information. That’s fine when done explicitly and accompanied by uncertainty analysis to illuminate how the analyst’s assumptions affect the results. The problem here isn’t that there’s a missing piece of information, however, but rather that the entire data set, because of its limitations, cannot support credible investigation of the research question.
In a comment on earlier post, Professor Sorrell praises Dr. Saunders’ analysis for its nuance, asks what would happen if we had re-run his model with better data, and wonders why we didn’t report any such results:
A commendable feature of [Dr. Saunders’] paper is the 3 pages devoted to listing ‘cautions and limitations’. The potential inaccuracies in energy price data simply adds one point to this list. In the absence of any empirical tests (why not repeat the analysis with the revised data??), you have not demonstrated that the data inaccuracies lead to any systematic bias in the rebound estimates, or that the bias is necessarily upwards rather than downwards. Hence, it is misleading to conclude that the results are 'wholly without support’.
Our response: Professor Sorrell addresses only one of the two major errors we identified in Dr. Saunders’ analysis (data quality). In ignoring the other (data structure), he calls for the impossible.
First, let’s review the structural issue. Again, Dr. Saunders’ data report national average energy prices, not the sector-specific prices he claimed to be using. The idea that this fundamental misunderstanding can be corrected by adding another bullet point to a list of caveats would be an audacious remedy, as we pointed out previously:
Lest this seem like a petty academic grievance, it’s as though Dr. Saunders set out to study the performance of individual NFL quarterbacks when their teams are behind in the third quarter of play, but did so using league-wide quarterback averages across entire games—not third-quarter statistics for each player. If that doesn’t sound credible to sports fans, trust us, it’s an even bigger problem when you’re talking about the last fifty years of U.S. economic history.
If Professor Sorrell only meant to suggest that the data qualityproblems could be addressed with a new caveat, he nevertheless glosses over the structural issues. On their own, the structural issues offer sufficient reason to question Dr. Saunders’ results.
Let us assume that Professor Sorrell is concerned more with the data quality issues we raise. As we discuss at great length in our response article and its supplemental information—have our critics yet digested these documents?—one cannot actually trace the primary source of Dr. Saunders’ data. That should be reason enough to take stock of the reasonableness of their use. If additional reasons are desired, the data documentation includes more than a few heroic (and largely arbitrary) assumptions necessary to fill in gaps in the historical record; a heavily footnoted research trail in our supplemental information provides a map for the interested reader.
Having dug into the details, our view is that one simply can’t treat these energy data as precise for the purposes of econometric modeling of the rebound effect.
Consistent with Professor Sorrell’s suggestion, we would have been be happy to apply Dr. Saunders’ model to a more robust data series, except that (as we once again pointed out in our article) no such data exist: Dr. Saunders’ model requires data at a level of detail that simply is not available in the United States. Reconstructing the data from primary sources or addressing their current validity in light of the lack of primary data sources would take a PhD dissertation, not an extra footnote—if it could even be done at all with the available primary sources, which remains an open question.
To recap, Dr. Saunders mistakenly employed national average energy prices while believing his model was processing sector-specific price data. Moreover, he treated his data as though they were precise, when a closer examination reveals their construction involved several unfounded assumptions and oversimplifications that should undermine confidence in any subsequent econometric analysis. That one cannot trace the data back to its primary sources adds an additional layer of concern for anyone with high standards for data quality. As a result, the data structure and data quality issues are each fundamental problems with the published analysis, not missing entries on a long list of caveats.
Hence, we concluded that Dr. Saunders’ results are wholly without support because his data do not match his model specifications and because the available primary data cannot address the research question at hand.
Argument #2: It’s All About the Variation
Dr. Saunders makes the most direct defense of his paper, arguing that his model accurately captures the essence of the rebound effect despite imperfections in the data:
Not clear that the absolute energy price matters much. Variation is fundamental driver. Historical energy price sets used for econometrics vary by nearly an order of magnitude over the time series, sufficient to tease out production behavior over a wide range of input prices.
The premise here is that other models are successfully calibrated using data featuring levels of variation that are comparable to those found in Dr. Saunders’ own data. Dr. Saunders therefore suggests that his data are sufficient to calibrate the model in a way that allows it to achieve statistical validity.
With respect, we’re not comfortable with the idea that using incorrect absolute energy prices is immaterial to the validity of one’s results. Assuming, however, that for some particular statistical model the variation in energy prices is the only key input variable, Dr. Saunders still hasn’t made a reasonable defense. A data set might contain sufficient variation in order to be sure that a model is exposed to a wide range of input data that covers the relevant analytical space in mathematical terms. But nothing about that statement indicates that the reported variation accurately reflects the actual economic choices the data are supposed to measure.
In other words, there may be sufficient variation in Dr. Saunders’ data to ensure that the model can be calibrated using these data, but that doesn’t say anything about the accuracy of either the data or results. (Or more bluntly: variable garbage in, well-calibrated garbage out.)
We are reluctant to re-hash all of our data concerns here. After all, that’s why we wrote a paper and included a lengthy technical appendix, the substance of which none of our critics has yet addressed. But for the sake of argument, we’ll review two issues here to hammer the point home.
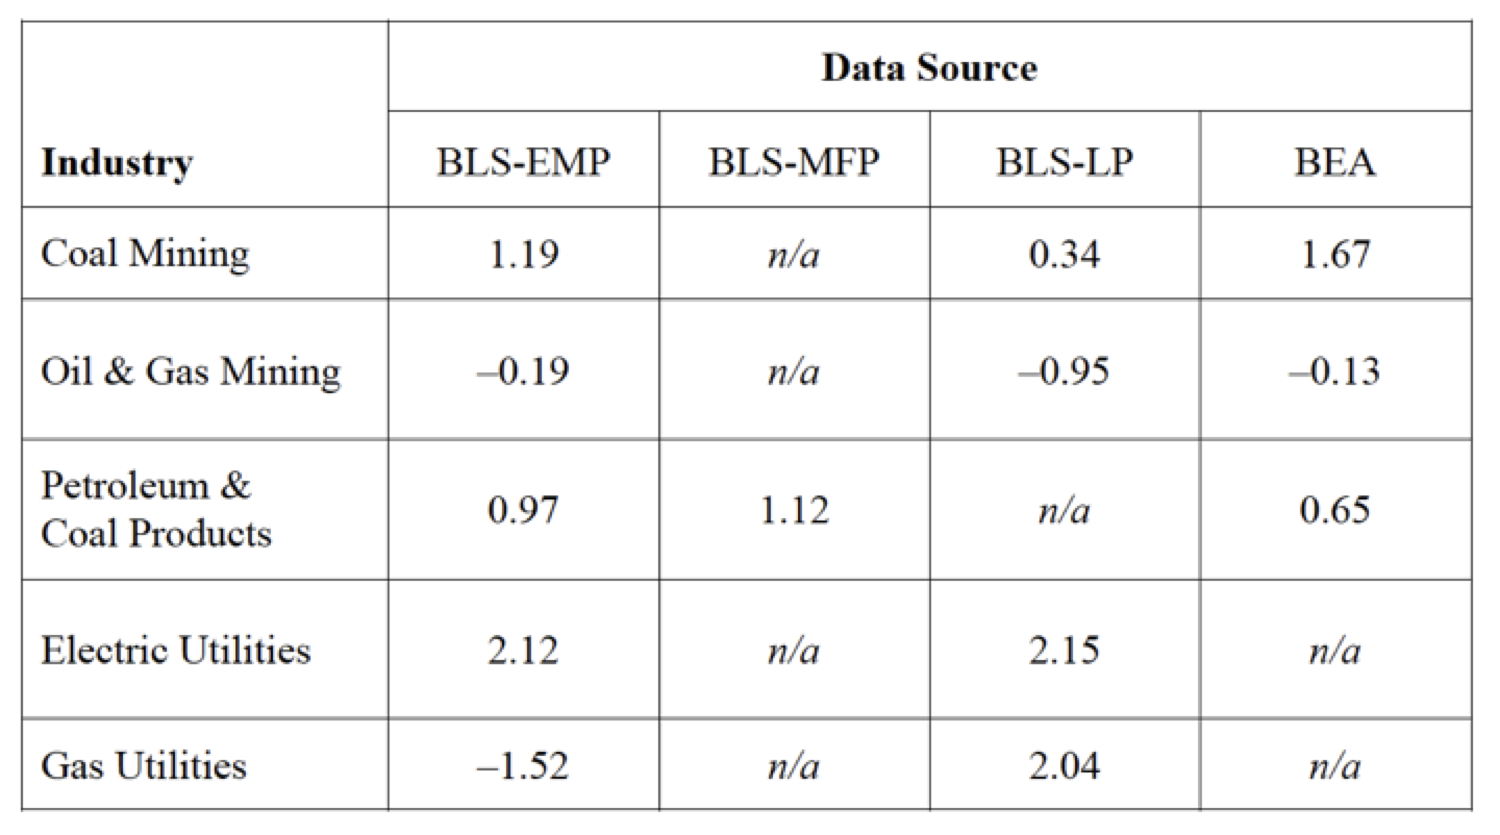
First, in one of the references in Dr. Saunders’ paper (Jorgenson et al., 2005),[1]the authors of Dr. Saunders’ data describe how the selection of different primary data sources would change key parameters in the data set Dr. Saunders used. As we discuss in our response article, the KLEM data are the product of input-output (I–O) tables, which show the annual expenditure flow between each of 35 industries in the accounting system Dr. Saunders employed. In Table 1 below (see Table SI-1 in our appendix), we illustrate how four different primary data sources from the Bureau of Labor Statistics (BLS) and Bureau of Economic Analysis (BEA) report different gross output growth rate statistics for each of the five energy sectors in the KLEM data series (i.e., the “E”). (Professor Jorgenson ultimately selected the BLS-EMP series, though as we discuss in our article’s appendix, BLS no longer publishes these data.)
As Table 1 shows, there is a huge amount of variation across primary data sources—not the good kind, unfortunately, but the type that illustrates how uncertain the selected data are. But the story is even more problematic than that. These statistics are for output growth rates for each of the sectors, not the I–O tables at the core of Professor Jorgenson’s (and hence, Dr. Saunders’) data. Gross output by sector is much easier to estimate than are I–O tables because there are gross outputs for each of n sectors (n=35) while an I–O table is a matrix with n2 entries (35 x 35 = 1225). The best statistical estimates of I–O tables are made in the so-called benchmark economic surveys that BEA conducts once every five years; data for the years in between are extrapolated, not directly observed. So it’s very likely that there is even more variation (and therefore less precision) across primary data sources that attempt to estimate the full I–O matrix.
Table 1: Comparison of average annual growth in gross output by sector and data source (average % growth per year, 1987-2000)
As a final point, Table 1 reports the five industries constituting the “E” in the KLEM data series and in Dr. Saunders’ model; each is represented by a single national average price. Yet most energy economists would not recognize each of the five “E” economic categories as representative of real energy markets or energy prices: for example, our earlier post showed how electric utility rates vary widely by sector and geography, and are not readily related to a single national average. (Again, these are national averages, not marginal prices; marginal prices are the fundamental driver of rebound effects in standard microeconomic theory and differ substantially from average prices in the electric sector.)
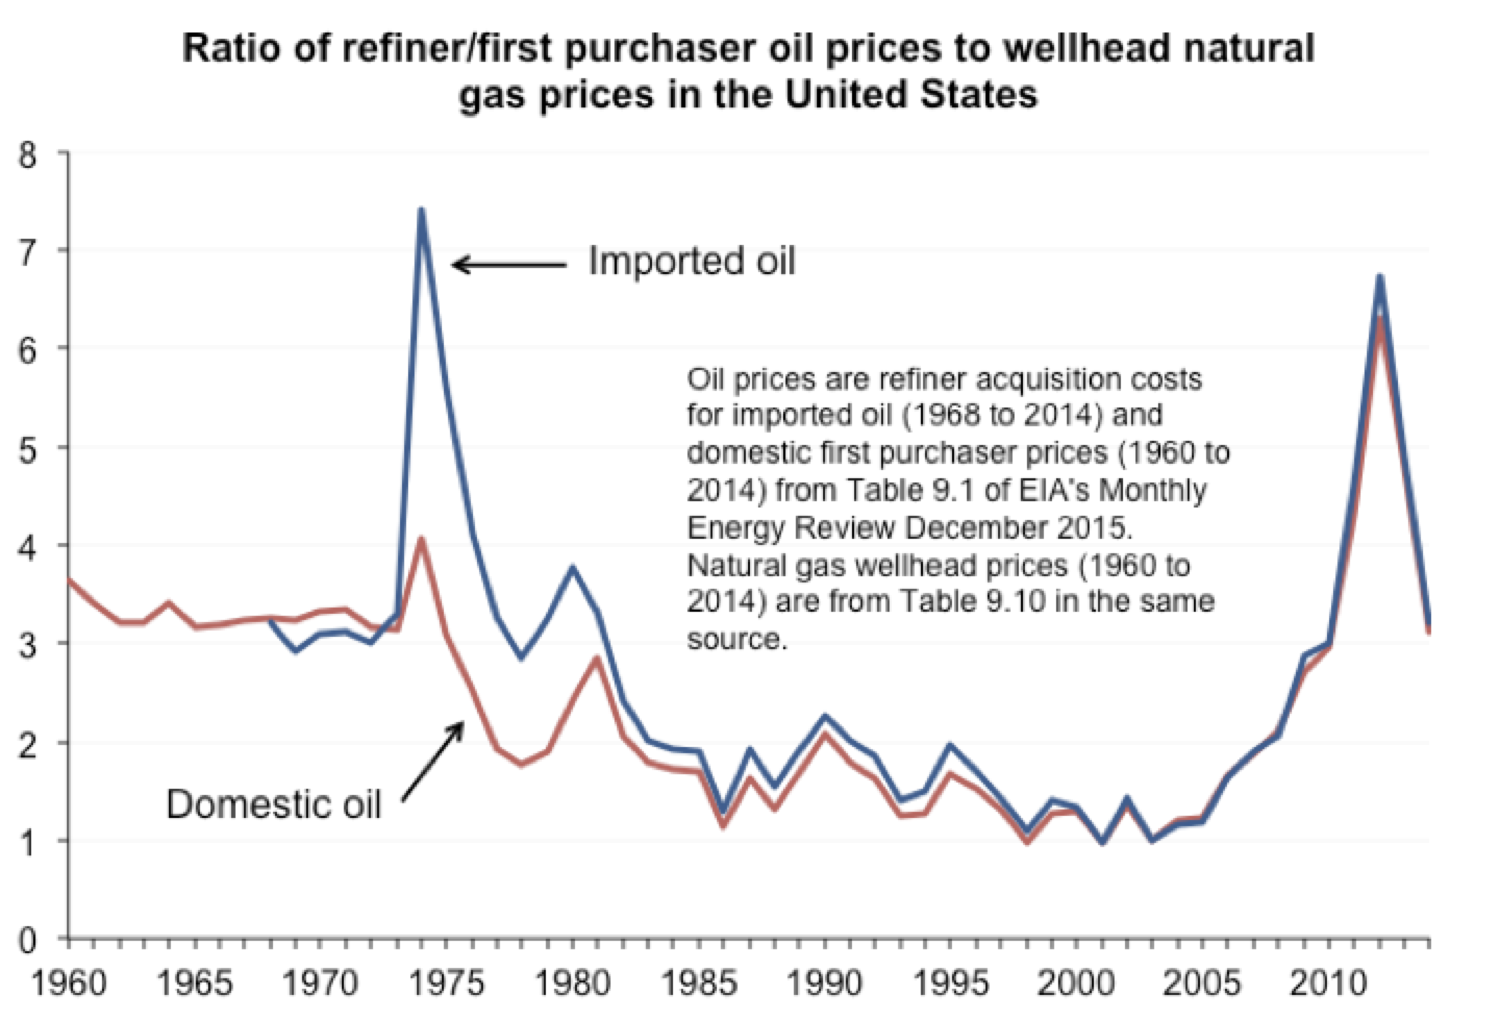
As an additional example, we’d point to the “Oil & Gas Mining” sector, which combines all domestic oil and gas production. In Dr. Saunders’ data, there is a single price signal for consumption of domestic oil and natural gas, two fossil fuel resources that have in reality experienced great and uneven changes over the last 50 years. Below, we use Energy Information Administration data to plot the ratio of oil prices to wellhead natural gas prices as a simple visual measure of how unreasonable that assumption is, given that (1) natural gas and oil often compete with each other and (2) relative prices matter a great deal in determining such choices.[2]
Figure 1: Ratio of oil to natural gas prices
A quick review of the figure shows that oil and natural gas prices do not vary in tandem. Indeed, there are two periods of significant relative price shocks in which oil prices spiked relative to gas prices. Most famously, this occurred during the mid-1970s oil crisis, during which time domestic price controls led to a significant divergence between the price of domestic and imported crude oil. Thus, if a firm had a long-term contract with a domestic oil producer, it faced a substantially different price compared to a competitor who had to buy imports from the global crude market. Subsequently, price controls were lifted and the difference between domestic and imported prices diminished.[3]
As the figure illustrates, nothing about economic history suggests that a composite oil and gas production sector (with one average price series representing both resources) could accurately measure the variation in relative gas and oil prices that actual economic actors have faced since 1960. Yet this assumption is necessary for the I–O structure of Dr. Saunders’ data to function and is therefore an embedded error in his assessment of sector-level rebound effects.
Argument #3: Everyone is Doing It
Another argument suggests that the problems we identify in Dr. Saunders’ article are no more significant than is the norm in acceptable scholarship in this area of research.
Here is Professor Sorrell again:
Your critique over potential inaccuracies in the energy price data could probably be extended to the capital, labour and materials data - where measurement problems are greater. But you would need to be acknowledged [sic] that these issues are not unique to Saunders paper, or to Jorgensen’s huge body of work, but are generic to the majority of work in this area.
Dr. Saunders echoed this view as well:
Your critique would extend to all of Dale Jorgenson’s multiple peer-reviewed energy studies. Doubtful he would see a serious problem.
Our response: The energy data (which were prepared by Harvard Professor Dale Jorgenson) are indeed problematic, no matter the prestige of their users or developers. Dr. Saunders’ initial misunderstanding about the structure of these data is entirely unrelated to Professor Jorgenson’s work and sufficiently problematic on its own, but our concerns about the underlying quality of the data do apply more broadly.
As for the comparison to the other KLEM data categories (capital [K], labor [L], materials [M]), we didn’t do the heavy lifting and so have been careful not to comment on this issue in the article or in our earlier blog post. As outsiders to the field of macroeconomic accounting, our presumption was that experts are engaged in detailed discussions of the uncertainties inherent in these estimates and are attempting to address the associated uncertainties in an academically rigorous way.
However, if Professor Sorrell is correct to suggest that the data for capital, labor, and inter-industry transactions are as bad as they are for energy but are not subject to comprehensive uncertainty analysis, then that should give us all pause. Certainly we can’t imagine using problematic data in our own work. Does anyone think the standard should be lower?
Argument #4: Saunders as Strawman?
Separately, Mr. Jenkins and Mr. Nordhaus also addressed our criticism of the Breakthrough Institute report, which heavily featured Dr. Saunders’ results. They argue that it isn’t fair to impugn the whole BTI report based on issues with, as Mr. Jenkins put it, one of over a hundred references. Mr. Nordhaus even went so far as to say that our criticisms of Saunders’ paper amount to “cherry picking” and “knocking down strawmen” when it comes to BTI’s view of the rebound effect.
We are disappointed in these responses for two reasons.
First, as we documented in our original blog post, Dr. Saunders’ article was the very centerpiece of the 2011 BTI report. Indeed, it provided the sole empirical claim to novelty compared to earlier reviews of rebound by Professor Sorrell, the late Lee Schipper, and others. The BTI authors referred to the Saunders analysis again and again, as we described in our previous post:
In most literature reviews, individual paper results are reported in tables or figures and, where the insights or methods are particularly important, briefly discussed in the main text. In contrast, the Breakthrough Report cites Dr. Saunders’ paper 25 times across 17 pages, with several full-page discussions and a detailed reproduction of its complete results. No other citation received anywhere near this level of attention.
Thus, the notion that this is just one reference out of a hundred is entirely misleading. Dr. Saunders’ attention-grabbing results were what gave the BTI report salience, providing an intellectual platform for the backfire narrative that Mr. Nordhaus and Mr. Shellenberger have since developed at BTI. Without Dr. Saunders’ results the 2011 report would not have been nearly as interesting to the outside world.
Second, it’s not at all clear whether Mr. Jenkins and Mr. Nordhaus stand by the work of their BTI colleague, Dr. Saunders. For example, in his recent posts on Twitter, Mr. Jenkins never opined on the validity of Dr. Saunders’ results, focusing instead on a defense of the 2011 BTI report he authored primarily based on the other references and findings it contained. (Indeed, at times Mr. Jenkins now sounds less like his former BTI colleagues and more like his fellow academic researchers writing on energy efficiency and rebound.)
For his part, Mr. Nordhaus has not offered any specifics regarding Dr. Saunders’ work, other than to endorse Professor Sorrell’s comment and Mr. Jenkins’ tweets.
Perhaps Mr. Jenkins and Mr. Nordhaus wish to clarify their positions on Dr. Saunders’ conclusions. Is the validity of Dr. Saunders’ results relevant to evaluating the 2011 BTI report? If not, why not? And if (as Mr. Jenkins suggests) Dr. Saunders’ analysis isn’t material to the BTI report’s conclusions, why was it featured so heavily before it had been peer reviewed?
Argument #5: The Burden of Proof
Ultimately, the argument over how to adjudicate Dr. Saunders’ article and our response comes down a debate over who bears the burden of proof.
As Dr. Saunders put it:
Of course the analysis stands to be improved by further geographic decomposition for each sector. Even better, firm-by-firm, but … [the] burden of proof rests on any who claim further disaggregation would substantially change results.
Professor Sorrell struck a similar tone:
Saunder’s [sic] aim in setting out the various 'cautions and limitations’ is to “encourage researchers to find ways to overcome them if energy efficiency rebound is to be properly understood”. That is the spirit in which the issue should be approached - improving our understanding of a complex phenomenon through better data and empirical methods. Identifying problems with the energy price series can contribute to that. But only if followed through with a revised analysis that contributes to the growing evidence base. Not as a basis for reinforcing entrenched positions[.]
Both Dr. Saunders and Professor Sorrell get this one backwards. The scientific process is all about evidence. If the evidence turns out to be weak, good scientists revisit their conclusions and revise them accordingly. That standard is all the more important in the social sciences, where human behavior makes for messier data.
We’ve done our best to make a clear case showing how Dr. Saunders’ energy data are severely flawed. Insisting that we go a step further and fix those problems, despite the fact that we’ve identified a lack of primary data necessary to that fix, is asking too much. It is sufficient for us to show that the existing data cannot support the conclusions Dr. Saunders and his BTI colleagues draw. Others can, if they wish, attempt to remedy those problems—but that is neither our job nor a prerequisite for a valid critique.
If anything, Dr. Saunders had an obligation to proactively address the shortcomings we found in his data. As we mentioned in our previous post, we discussed our concerns about data quality with him and Mr. Jenkins over a private lunch in March 2011 and again in June 2011 at a Carnegie Mellon University technical workshop in Washington, DC (PDF slides available here). Yet Dr. Saunders’ published article contains no mention of these issues. Surely timing wasn’t the problem: Technological Forecasting & Social Change reports that the initial manuscript was received in December of 2011; Dr. Saunders later provided a revised manuscript in response to reviewer comments in November 2012, a year and a half after we alerted him to a serious problem. When a researcher forges ahead with an approach that is known to be problematic, he doesn’t have the right to ask his critics to re-do his work for him.
Rather than double down on conclusions not supported by the data, Dr. Saunders and his colleagues should acknowledge the flaws in his analysis and cease relying on it to support any propositions about the rebound effect.
Conclusions
Our critics do not offer substantive defenses of Dr. Saunders’ analytical errors, nor can they explain away the Breakthrough Institute’s rhetorical overreaches in promoting them.
Documenting these problems does not tell us what the true magnitude of the rebound effect is, but it nevertheless offers reason to look elsewhere for that answer in the future. As we made clear in our journal article and earlier blog post, our work doesn’t attempt to estimate the likely range of rebound effects. Instead, we recommended several academic reviews from balanced and well-respected researchers at UC Berkeley, UC Davis, Yale, Carnegie Mellon University, and the Environmental Defense Fund. (Professor Sorrell’s 2007 UKERC review is another useful resource, though we expect he would agree that more contemporary assessments have captured additional studies published in the last ten years.)
In the end, credibility matters in this debate because energy efficiency research requires attention to detail, consistency between empirical evidence and theoretical modeling, and above all a commitment to intellectual integrity. We are sure that researchers like Dr. Saunders, Professor Sorrell, and Mr. Jenkins share these values, although we are equally confident that (1) the evidence does not support Dr. Saunders’ findings and (2) the 2011 BTI report from Mr. Jenkins, Mr. Nordhaus, and Mr. Shellenberger prematurely promoted Dr. Saunders’ results.
Finally, although we don’t seem to find much common ground on the technical issues, we appreciate the collegiality that Dr. Saunders, Mr. Jenkins, and Professor Sorrell have maintained throughout our discussions. It’s easy to let things get out of hand when arguing over contentious policy issues, and we are glad that this group is committed (as are we) to keeping the debate substantive and professional.
Corrigendum
*Our original post stated that Professor Sorrell is a Senior Fellow at Breakthrough Institute. However, Dr. Saunders informs us that Professor Sorrell is not and has never been formally affiliated with BTI. We regret the error and apologize for any confusion.
References
[1] Jorgenson, D., M. Ho, K. Stiroh (2005). Productivity (Volume 3): Information Technology and the American Growth Resurgence. Cambridge, M.A.: The MIT Press (see Table 4-4 on pp. 116-17).
[2] Oil prices are refiner acquisition costs for imported oil (1968 to 2014) and domestic first purchaser prices (1960 to 2014) from Table 9.1 of EIA’s Monthly Energy Review (December 2015). Natural gas wellhead prices (1960 to 2014) are from Table 9.10 in the same source. . Natural gas prices converted from $/cubic foot to $/mmBtu assuming 1029 Btu/cubic foot. Oil prices converted from $/bbl to $/mmBtu using 5.8 mmBtu/bbl.
[3] Although it is not relevant for the period of Dr. Saunders’ study, a similar episode occurred more recently with high world oil prices and abundant (but physically stranded) North American natural gas resources due to fracking. A separate and potentially more relevant episode concerns the domestic natural gas market. The gas market experienced significant regulatory changes over the long period of Dr. Saunders’ study, although the effects are not visible in the simple metric of price ratios we have chosen for the figure. Briefly, natural gas wholesale prices were federally regulated until the mid-1970s, with reforms eventually leading over the next decade or so to market-based wholesale prices based on regulated open-access interstate pipeline networks. During this time, wholesale consumers who signed long-term contracts at regulated prices faced significantly different prices than those who bought wholesale natural gas at market rates. Thus, the marginal price of natural gas industrial consumers experienced varied much more widely than a national average price would suggest.
Summary: About once a decade, a slew of popular headlines wrongly claim that energy efficiency doesn’t actually save energy or reduce emissions due to the rebound effect. We describe a recent episode in which headline-grabbing but fatally flawed claims on rebound misled policymakers and researchers.
In February 2011, Jesse Jenkins, Ted Nordhaus, and Michael Shellenberger of the Breakthrough Institute released a widely read report reviewing the academic literature on energy efficiency and the rebound effect. And what, you might ask, is the rebound effect? As the authors put it:
Economists … have long observed that increasing the efficient production and consumption of energy drives a rebound in demand for energy and energy services, potentially resulting in a greater, not less, consumption of energy …. This is known in the energy economics literature as energy demand ‘rebound’ or, when rebound is greater than the initial energy savings, as ‘backfire.’[1]
The big issue here is the extent to which energy efficiency technologies and policies actually reduce energy consumption (and thereby avoid CO2 emissions). If policymakers fail to properly account for rebound effects, they will overestimate the contribution of energy efficiency in their climate strategies—a potentially critical shortcoming, as most climate mitigation efforts rely heavily on energy efficiency in both the developed and developing world.
Given the stakes, it should come as no surprise that a well-written popular literature review on this subject was poised to make headlines (e.g., in The New York Times, Nature, Huffington Post, and Conservation Magazine). All the more so, since the Breakthrough Report made an ostensibly strong case for backfire—the outcome in which efficiency actually causes greater consumption:
This review surveys the literature on rebound and backfire and considers the implications of these effects for climate change mitigation policy…. Rebound effects are real and significant, and combine to drive a total, economy-wide rebound in energy demand with the potential to erode much (and in some cases all) of the reductions in energy consumption expected to arise from below-cost energy efficiency improvements.[2]
In an accompanying blog post, the report’s authors claimed that the “expert consensus and empirical evidence that energy efficiency causes large rebounds and backfire is mostly unknown in the United States,” suggesting that energy efficiency advocates like Amory Lovins have “major media personalities” that block the truth from coming to light. And the truth, Mr. Jenkins wrote, is a sobering thing:
For every two steps forward we take with below cost energy efficiency, rebound effects mean we take one or two steps backwards, sometimes enough to completely erode the initial gains.
On the occasion of the 2014 Nobel Prize in Chemistry being awarded to the inventors of high-efficiency LED lighting technology, Mr. Shellenberger and Mr. Nordhaus criticized the Royal Swedish Academy of Sciences for citing the energy efficiency savings this technology would bring. In a New York Times OpEd, they claimed that:
LED and other ultraefficient lighting technologies are unlikely to reduce global energy consumption or reduce carbon emissions.
This is the stuff of Malcom Gladwell and Freakonomics, not the dry world of academic symposia. According to the Breakthrough Institute, everything you thought you knew about energy efficiency is wrong—and not just wrong, but totally backwards!
A thumb on the scale
If one digs into the 2011 Breakthrough Report, however, it turns out that the support for high rebound and backfire comes not from a systematic survey of a vast set of papers that document these outcomes in practice, but rather from two much more limited sources. One was a set of theoretical modeling studies (i.e., computer exercises, not empirical evidence). The second and most important source was a then-unpublished working paper from Dr. Harry Saunders, a Senior Fellow at the Breakthrough Institute.
Dr. Saunders’ empirical study found high rebound effects and even backfire across multiple industries in the United States. As the Breakthrough Report noted:
While Saunders (2010) is still in review as this paper is written, it represents an important contribution to the study of rebound effects that fills a key void in analysis of rebound for producing sectors of the economy. The paper is therefore included in this review despite its pre publication status.[3]
Reasonable people can debate the merits of including non-peer reviewed work in an authoritative literature review,[4] but Saunders’ report wasn’t merely included in the Breakthrough Report—it was the very centerpiece.
In most literature reviews, individual paper results are reported in tables or figures and, where the insights or methods are particularly important, briefly discussed in the main text. In contrast, the Breakthrough Report cites Dr. Saunders’ paper 25 times across 17 pages, with several full-page discussions and a detailed reproduction of its complete results.[5] No other citation received anywhere near this level of attention.
When the Breakthrough Report was released in early 2011, we expressed concerns over its conclusions, because we harbored serious doubts about the data Dr. Saunders used. Over lunch in Oakland that March, we shared our concerns with Dr. Saunders and Mr. Jenkins (now a PhD student at MIT)—both of whom are unfailingly cordial and professional, despite our differences—but to no avail.
Dr. Saunders insisted his data were of the highest quality, repeatedly invoking the reputation and authority of Professor Dale Jorgenson, the prominent Harvard economist who developed the dataset Dr. Saunders used. But we knew that no primary data were available to provide insights into industry-level prices and consumption data going back to 1960 and were concerned that Dr. Saunders had not appreciated the limitations of his secondary source.
As the rebound debate picked up steam that summer, one of us (D.C.) spoke at a Carnegie Mellon University workshop on the rebound effectand specifically addressed these limitations before a group of energy efficiency experts, including Dr. Saunders and Mr. Jenkins. Neither there, nor at any time since, were they able to explain how their data source obtained regional, industry-level data necessary to estimate the rebound effect by industry over some forty plus years. Yet in the publicity blitz accompanying the Breakthrough Report, not a word was heard about the data quality at the core of Dr. Saunders’ featured results.
Publish first, then peer review
Eventually, Dr. Saunders’ paper was published in the journal Technological Forecasting & Social Change in 2013.[6] Now that his article is in the peer-reviewed literature, official scientific reviews—such as the Intergovernmental Panel on Climate Change (IPCC)—must consider Dr. Saunders’ results, and therefore we felt compelled to formally document our findings. The same journal recently published our response article.[7]
Our work confirms that Dr. Saunders’ data actually concern national average prices, not the sector- and location-specific marginal prices that energy economists agree are necessary to evaluate the rebound effect. The distinction is most important because actual energy prices vary widely by sector and location; in addition, economic theory asserts that changes in the marginal (not the average) price of energy services cause the rebound effect. As a result, Dr. Saunders’ findings of high rebound and backfire are wholly without support.
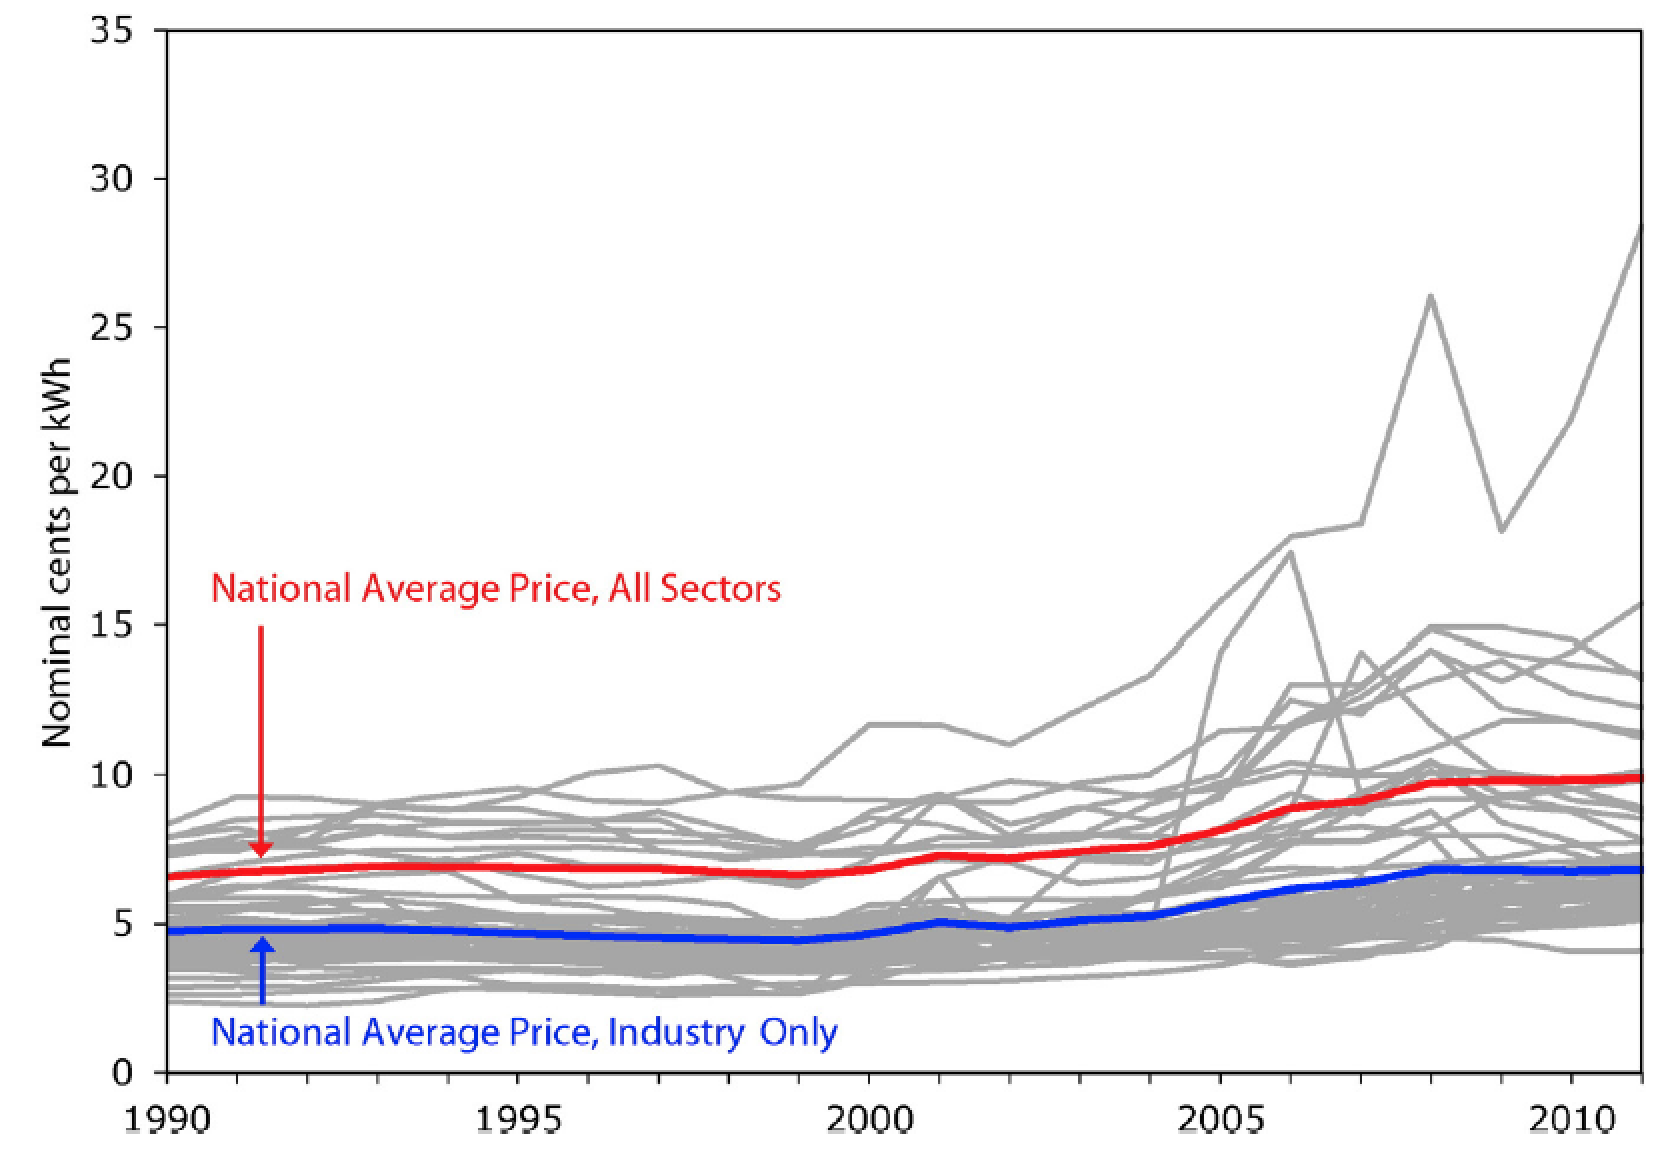
Fig. 8 from Cullenward and Koomey 2016. Industrial electricity prices by state (EIA data). This figure illustrates the variation in average annual electricity prices by state—this time, in the industrial sector. The fact that industrial prices are typically much lower than the average electricity price suggests that the use of national average prices significantly distorts the price signal facing most industrial customers. Each gray line represents the average annual price of electricity in one of the 50 states. The blue line is the average price for electricity in the industrial sector across the United States. The red line is the average price for electricity across all sectors in the United States. (For interpretation of the references to color in this figure legend, the reader is referred to the web version of this article.) And yes, we know that it’s generally better to plot inflation adjusted prices, but because the underlying data in the Jorgenson data is in nominal dollars, we continue to use that convention in our article.
Lest this seem like a petty academic grievance, it’s as though Dr. Saunders set out to study the performance of individual NFL quarterbacks when their teams are behind in the third quarter of play, but did so using league-wide quarterback averages across entire games—not third-quarter statistics for each player. If that doesn’t sound credible to sports fans, trust us, it’s an even bigger problem when you’re talking about the last fifty years of U.S. economic history.
In addition, we showed how the data set Dr. Saunders used is an incompletely documented amalgamation of sources that are no longer publicly available. The U.S. government stopped publishing the primary sources that Professor Jorgenson originally used to create his data set; and on top of that, his reported energy prices are inconsistent with current government energy data. Professor Jorgenson’s efforts may reflect the best attempt to reconcile a messy historical record, but data of this quality must be carefully examined in secondary studies like Dr. Saunders’, not treated as a perfectly reliable primary source with several decimal points’ worth of precision.
Whatever one makes of the limitations of these data, it is important to note that the debate between experts—an admittedly dry process that might not interest many readers—occurred after the Breakthrough Institute represented Dr. Saunders’ results as the new gospel on rebound. This is the opposite of the way the scientific process is supposed to work. Even though we shared our concerns with Dr. Saunders in the spring and summer of 2011, he did not even mention them in his published paper, which he submitted for peer review that December.
As an all-too-common result, the normal mechanisms of peer review and expert feedback played a diminished role after the media blitz of a counter-intuitive narrative on energy efficiency took its toll.
Lessons for the future
Savvy readers won’t be surprised that bold claims on rebound and backfire led to impressive media coverage. In order to justify its position, however, the Breakthrough Institute relied on a then-unpublished working paper that purported to upend the expert consensus on energy efficiency. It is now clear that Dr. Saunders’ conclusions were based on a critically flawed analysis.
Avoiding similar problems in the future requires more engagement between the scientific community and journalists. In particular, science communicators need to take time to confirm they have a new angle on an old story. Like many other issues in environmental policy, the rebound effect has a long history, with debates flaring up every ten years or so.[8]It is entirely possible that new evidence emerges to challenge the conventional wisdom, but journalists should be skeptical of counterintuitive findings that haven’t been vetted within the relevant expert communities.
When a bold new idea is ready for prime time, we are confident its proponents will be able to point to clear and convincing empirical evidence that illustrates well-defined causal mechanisms behind the novel findings.
Nevertheless, in some cases, the academic peer review process may prove too slow to showcase truly exceptional and time-sensitive developments. In these uncommon instances journalists should be particularly careful with technical claims made outside of the peer review process, however, and seek critical views from experts within the scientific community to vet and then comment on any stories deemed credible by that community. We aren’t suggesting that scientists should have the exclusive right to talk about technically complex policy matters, but nor should groups other than those experts dominate the narrative on issues with a rich scientific history.
So what should readers make of the rebound effect? In our view, energy economists agree that (1) backfire is exceedingly rare, and (2) the rebound effect, while important in some cases, is unlikely to offset the majority of expected savings.[9]We also welcome more research on energy efficiency policy and the rebound effect, particularly in emerging economies, where the issue has received less attention thus far.
And while the Breakthrough Institute is right to criticize those who push policymakers to completely ignore the rebound effect, their argument that energy efficiency fails to reduce energy consumption and carbon emissions is simply wrong. It’s time to move on.
About the authors
Danny Cullenward conducted this research during a Philomathia Research Fellowship at the University of California, Berkeley, where he taught climate law and policy. An energy economist and lawyer by training, his work focuses on the design and implementation of science-based climate policy.
Jonathan Koomey is a Research Fellow at the Steyer-Taylor Center for Energy Policy and Finance at Stanford University, worked for more than two decades at Lawrence Berkeley National Laboratory, and has been a visiting professor at Stanford, Yale, and UC Berkeley.
Notes
[1] Jesse Jenkins, Ted Nordhaus, and Michael Shellenberger, Energy Emergence: Rebound & Backfire as Emergent Phenomena. Breakthrough Institute Report (February 2011), page 4.
[4] Including within the Breakthrough Institute, it seems: BTI Senior Fellow Roger Pielke, Jr. strongly criticized the IPCC in 2009 for “laundering” non-peer reviewed findings into its high-profile climate science reports.
[5] We count citations by the number of paragraphs that specifically reference Dr. Saunders’ white paper, excluding multiple mentions within a single paragraph so as to conservatively assess its prominence in the Breakthrough Report. Dr. Saunders’ paper is discussed at length on pages 16-19 and 30-32, including a full page of results presented on page 18.
[6] Harry D. Saunders (2013), Historical evidence for energy efficiency rebound in 30 US sectors and a toolkit for rebound analysis. Technological Forecasting & Social Change 80(7): 1317-1330.
[7] Danny Cullenward and Jonathan G. Koomey (2016), A critique of Saunders’ ‘Historical evidence for energy efficiency rebound in 30 US sectors’, Technological Forecasting & Social Change 103: 203-213 (2016).
[8] See, for example, Daniel J. Khazzoom (1980), Economic implications for mandated efficiency in standards for household appliances. The Energy Journal 1: 21-40; John Henly, Henry Ruderman, and Mark D. Levine (1988), Energy Saving Resulting from the Adoption of More Efficient Appliances: A Follow-up. The Energy Journal 9(2): 163-170; Len Brookes (1990), The greenhouse effect: the fallacies in the energy efficiency solution. Energy Policy 18(2): 199-201; Lee Schipper (2000), On the rebound: the interaction of energy efficiency, energy use, and economic activity. Energy Policy 28(6-7): 351-353 (an entire special journal issue dedicated to the rebound effect); Steven Sorrell (2007), The Rebound Effect: an assessment of the evidence for economy-wide energy savings from improved energy efficiency. UK Energy Research Center Report.
[9] For a deeper treatment of the rebound issue, we recommend: Inês Azevedo (2014), Consumer End-Use Energy Efficiency and Rebound Effects. Annual Review of Environment and Resources 39: 393-418; Severin Borenstein (2015), A Microeconomic Framework for Evaluating Energy Efficiency Rebound And Some Implications. The Energy Journal36(1): 1-21; Kenneth Gillingham, David Rapson, and Gernot Wagner (2016), The rebound effect and energy efficiency policy. Review of Environmental Economics and Policy, forthcoming.
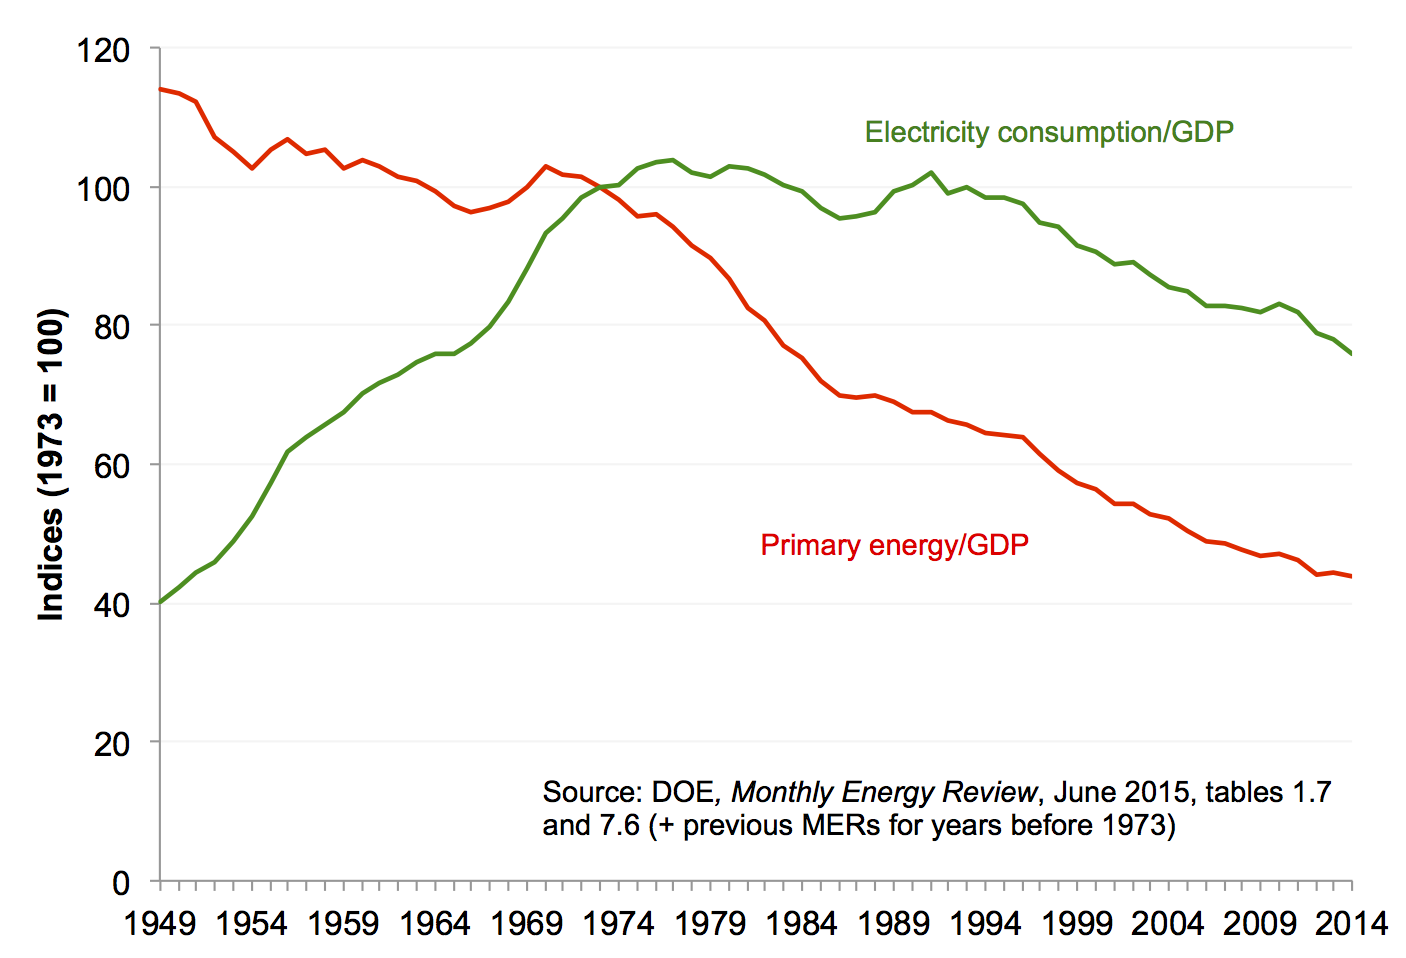
My colleague Richard Hirsh and I just published our article in The Electricity Journal titled “Electricity Consumption and Economic Growth: A New Relationship with Significant Consequences?”. The Electricity Journal. vol. 28, no. 9. November 2015. pp. 72-84. [http://www.sciencedirect.com/science/article/pii/S1040619015002067]
The data tell an interesting story. The decoupling of energy and GDP that happened in the US starting in the 1970s has been followed, a couple of decades later, by decoupling of electricity and GDP. We explore some possible explanations for this new development in the article.
Until January 3, 2016, you can download the article for free (please let me know if you have any issues downloading it). Also email me if you’d like the spreadsheet with all the data and analysis.
Here’s a summary of the article:
The growth rate of electricity consumption has important implications for business and public policy. Increasing use usually boosts electric utilities’ profits, but construction of new power plants to meet that demand may add to managerial and environmental woes. The traditional electric utility business model is predicated on continuing growth in consumption, and if the rate of growth slows (or becomes negative) profits will decline, especially if companies build unneeded generating plants.
This article describes altered trends in the relationship between growth in economic activity and electricity use and offers hypotheses for the changes, focusing on government policy, the changing structure of the American economy, increasing use of information and communication technologies, higher prices for power, and measurement biases.
From the early 1970s to the mid-1990s, electricity demand grew in lockstep with GDP, so that a 1% increase in economic activity implied a 1% surge in electricity use. But after 1996, the electricity intensity (electricity use per inflation-adjusted dollar of GDP) of the US economy began declining. Surprisingly, since 2007, electricity demand growth has been roughly flat, in spite of an 8% increase in real GDP, a situation that may presage a new phase of decoupling. The altered relationship between electricity consumption and economic growth requires all stakeholders in the utility system to rethink old assumptions and prepare for what appears to be the new reality of lower growth rates in electricity consumption.
The webinar will review the details adopted in the new WRI GHGP scope 2 guidance which requires a dual approach for reporting scope 2 GHG emissions and creates new accounting challenges and opportunities for reporting companies.
Anthesis & WRI will be offering a detailed presentation on the accounting principles set out in the new guidance, a step-by-step walk through of worked examples to illustrate the dual approach in practice, a discussion on how to collect and manage new sets of emissions factors, and a sure to be lively Q&A. Refer to our previous posts on this subject to get up to speed on these changes and learn more.
Both teams are top notch, and the subtleties of these reporting protocols are important for corporate sustainability folks to understand.
Addendum: For those who aren’t up on the definitions of scope 1, 2, and 3 emissions, here’s what the GHG protocol site says:
The GHG Protocol defines direct and indirect emissions as follows: Direct GHG emissions are emissions from sources that are owned or controlled by the reporting entity. Indirect GHG emissions are emissions that are a consequence of the activities of the reporting entity, but occur at sources owned or controlled by another entity.
The GHG Protocol further categorizes these direct and indirect emissions into three broad scopes:
Scope 1: All direct GHG emissions. Scope 2: Indirect GHG emissions from consumption of purchased electricity, heat or steam. Scope 3: Other indirect emissions, such as the extraction and production of purchased materials and fuels, transport-related activities in vehicles not owned or controlled by the reporting entity, electricity-related activities (e.g. T&D losses) not covered in Scope 2, outsourced activities, waste disposal, etc.
Cyclotron Road is building a new model to advance breakthrough energy technologies. Our purpose: support critical technology development for your project while helping you identify the most suitable business models, partners, and financing mechanisms for long term impact.
By joining Cyclotron Road, innovators receive a salary and seed funding, support from Lawrence Berkeley National Lab facilities and experts, targeted help with critical technology and manufacturing challenges, and connections to a deep network of academics, engineers, entrepreneurs, and industry experts who serve as mentors, collaborators, and commercial partners.
The application for Cyclotron Road’s second cohort is now open. They’re looking for the best, brightest, most driven energy innovators to join the second cohort. Visit cyclotronroad.org/apply to learn more.
Acceptance into the program offers:
• A personal stipend, travel allowance, and health benefits for up to two years • Lab space & technical collaboration support from Berkeley Lab experts and facilities • Cyclotron Road programming and mentorship
Application period closes on October 21st, 2015, so act fast!
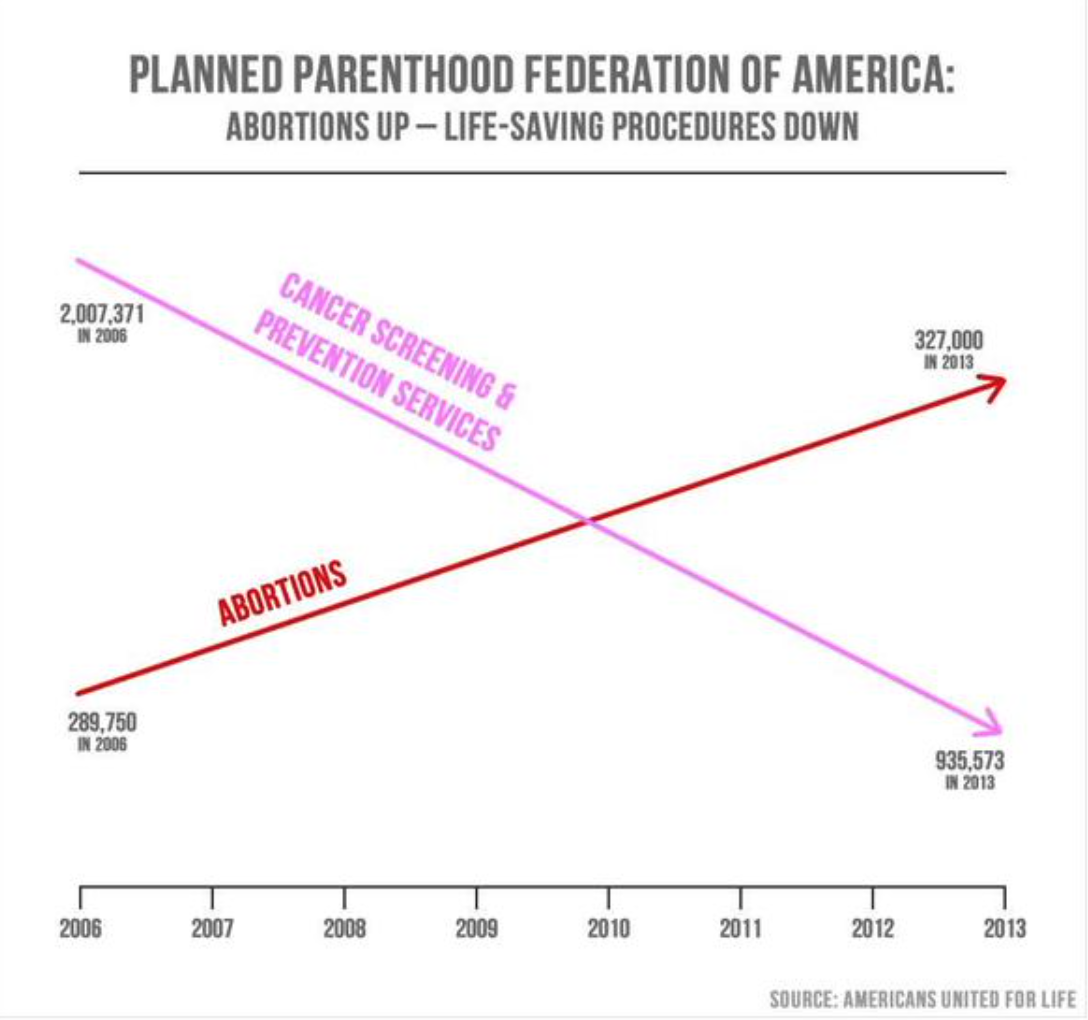
At hearings yesterday about Planned Parenthood, Rep. Jason Chaffetz (R-UT) put up the chart above. This tweet gives the apparent source of the graph, which is an anti-abortion organization. Abortion is of course a highly charged issue, and feelings run high, but there is no excuse for making a chart that misleads so blatantly. Whoever made the graph just superimposed two different graphs with different Y axes, making it quantitatively meaningless and highly misleading.
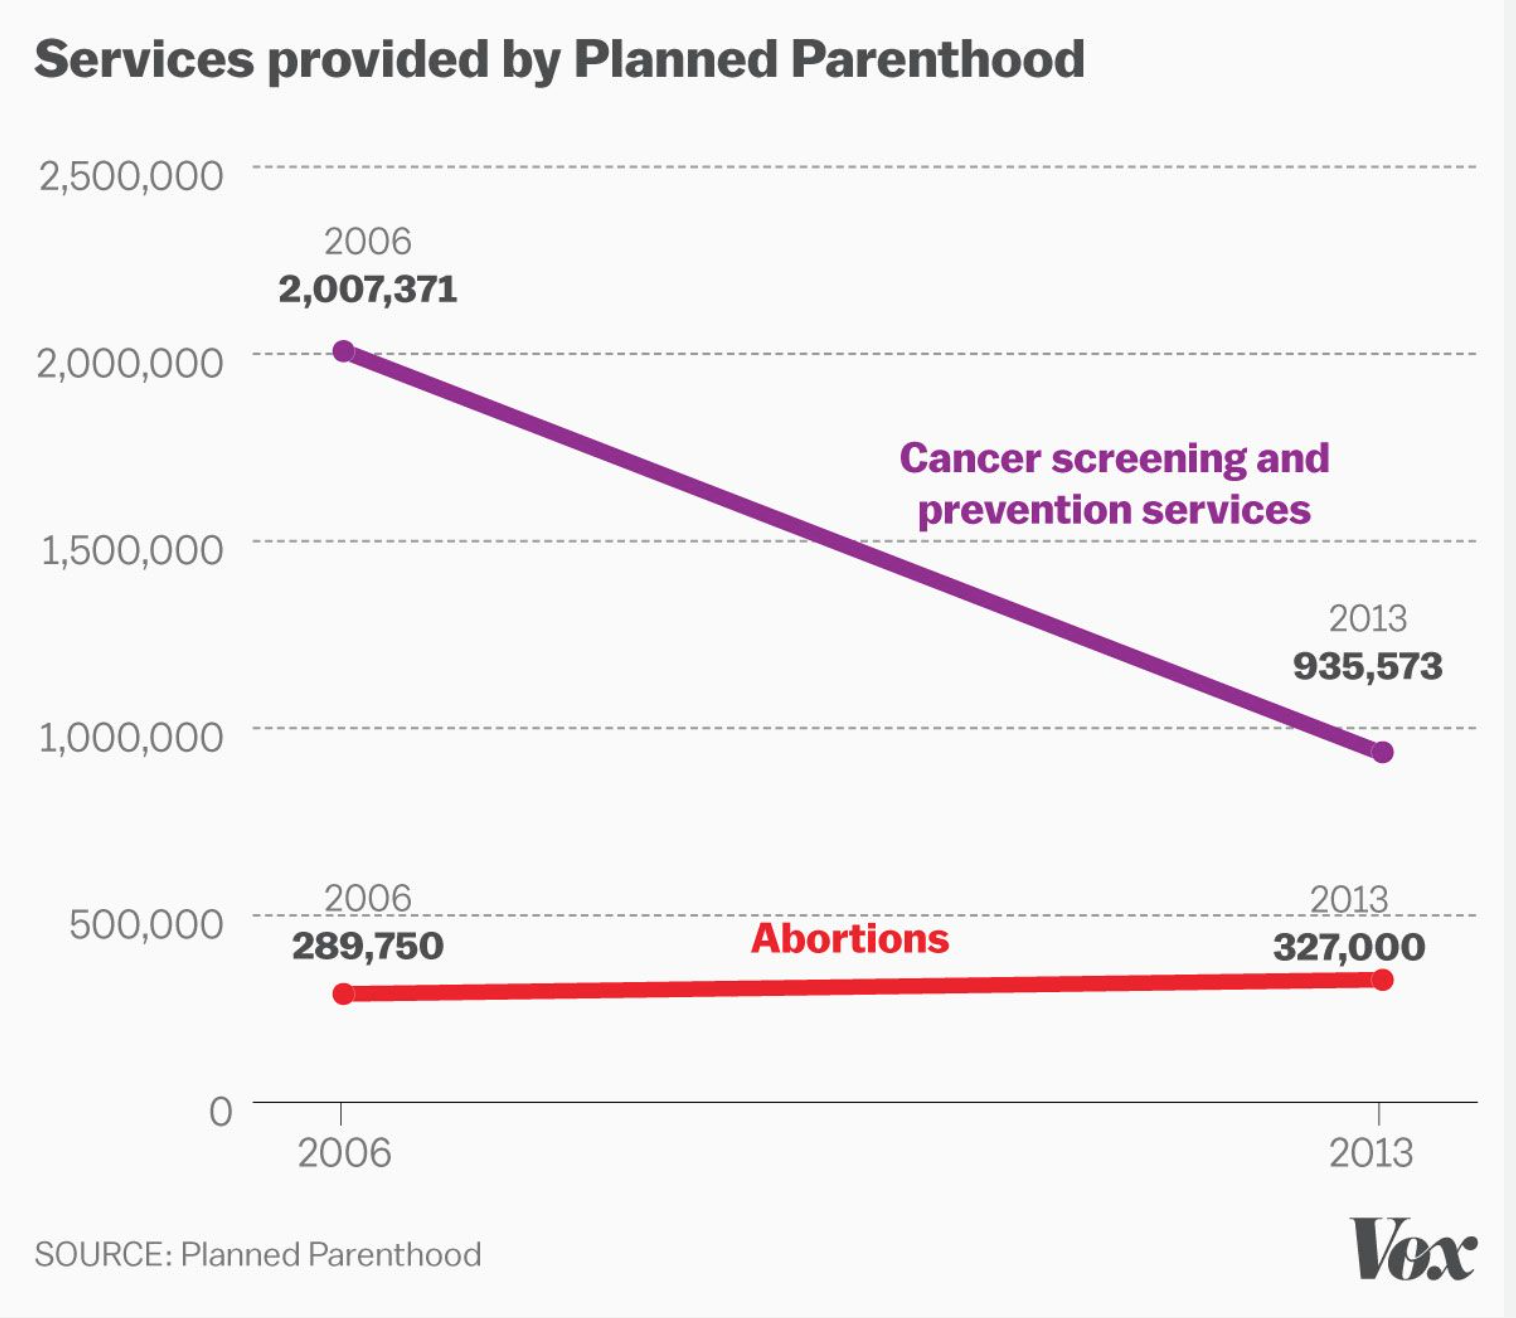
The 2nd graph tells a very different (and accurate) story. Shame on whoever made the first graph, and shame on Representative Chaffetz for using it. That’s lying with graphs in a truly blatant manner.
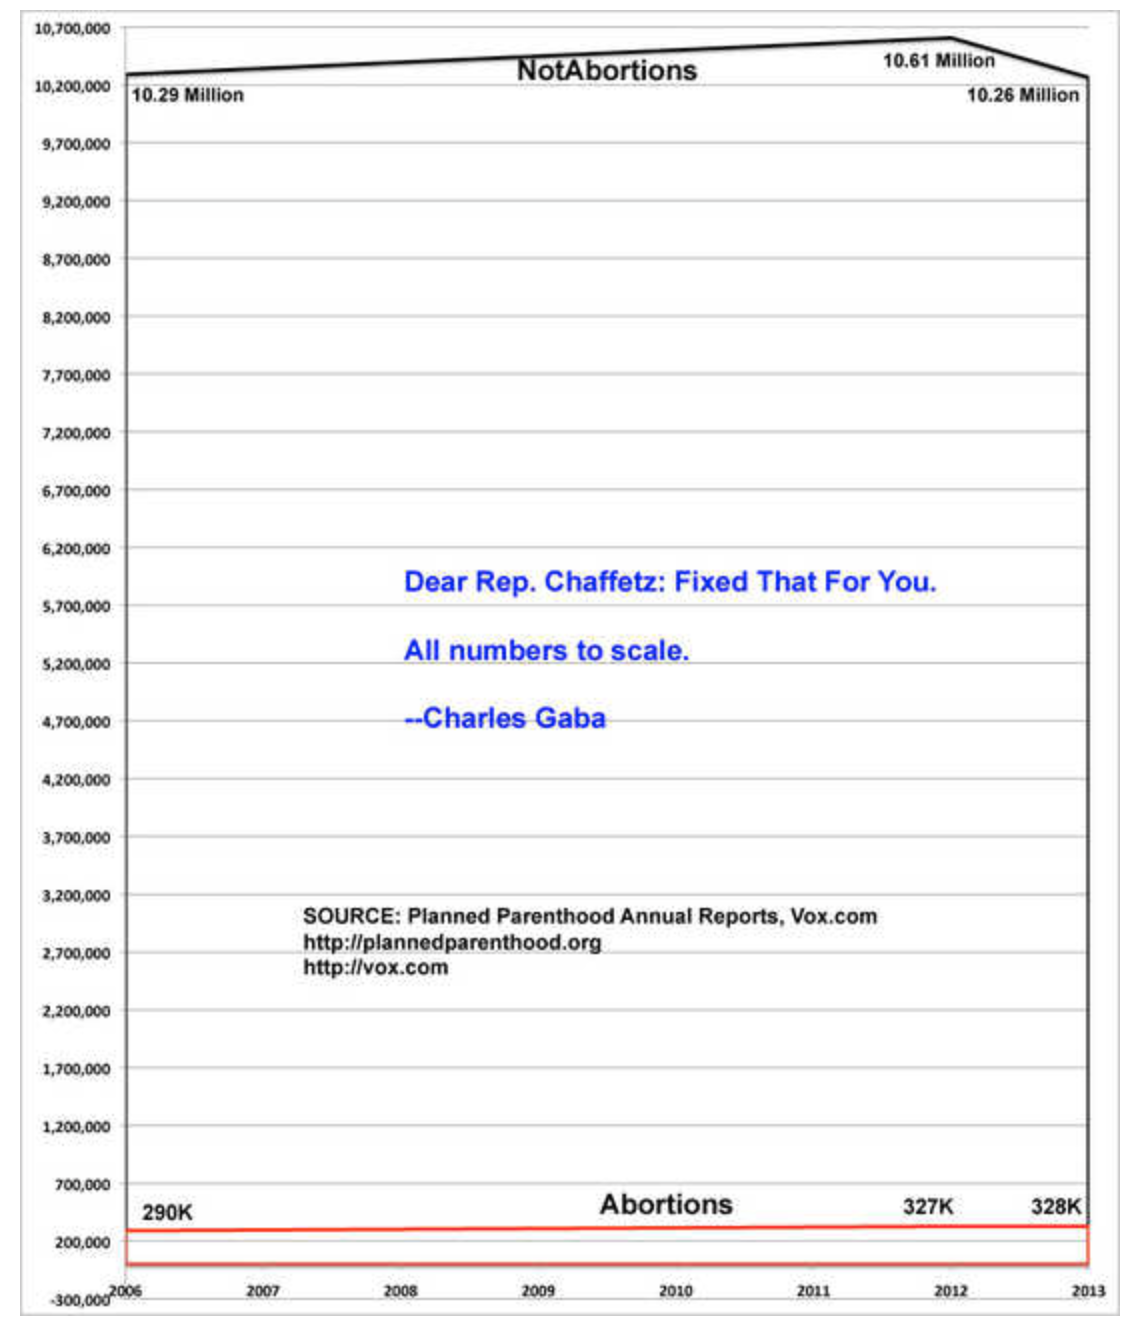
Update: Blogger Brainwrap at Daily Kos posted a different version of the graph that gives additional context, adding up all the various procedures performed by Planned Parenthood.
Cern datacenter Photo credit: By Hugovanmeijeren (Own work) [GFDL or CC-BY-SA-3.0-2.5-2.0-1.0], via Wikimedia Commons
I’ve been struggling for years to convince executives in large enterprises to fix the incentive, reporting, and other structural problems in data centers. The folks in the data center know that there are issues (like having separate budgets for IT and facilities) but fixing those problems is “above their pay grade”. That’s why we’ve been studying the clever things eBay has done to change their organization to take maximal advantage of IT, as summarized in this case study from 2013:
Schuetz, Nicole, Anna Kovaleva, and Jonathan Koomey. 2013. eBay: A Case Study of Organizational Change Underlying Technical Infrastructure Optimization. Stanford, CA: Steyer-Taylor Center for Energy Policy and Finance, Stanford University. September 26.
That’s also why I’ve worked with Heatspring and Data Center Dynamics to develop the following online course, which starts October 5th and goes until November 13th, 2015:
This is a unique opportunity to spend seven weeks learning from Jonathan Koomey, a Research Fellow at the Steyer-Taylor Center for Energy Policy and Finance at Stanford University, and one of the foremost international experts on data center energy use, efficiency, organization, and management.
This course provides a road map for managers, directors, and senior directors in Technology Business Management (TBM), drawing upon real-world experiences from industry-leading companies like eBay and Google. The course is designed to help transform enterprise IT into a cost-reducing profit center by mapping the costs and performance of IT in terms of business KPIs.
Executives in this course will gain access to templates and best practices used by leaders in your data center. You’ll use these templates to complete a Capstone Project, in which you will propose management changes for your organization to help increase business agility, reduce costs, and move their internal IT organization from being a cost center to a profit center.
I’m excited about this class, but we need more signups by early October. Please spread the word by sending this blog post to upper level management in the company where you work.
The Wall Street Journal today has an article by Bob McMillan highlighting my work with Anthesis and TSO Logic on zombie servers (those that are using electricity but delivering no useful computing services). To download our most recent report on the topic, go here.
Here are the first few paragraphs:
There are zombies lurking in data centers around the world.
They’re servers—millions of them, by one estimate—sucking up lots of power while doing nothing. It is a lurking environmental problem that doesn’t get much discussion outside of the close-knit community of data-center operators and server-room geeks.
The problem is openly acknowledged by many who have spent time in a data center: Most companies are far better at getting servers up and running than they are at figuring out when to pull the plug, says Paul Nally, principal of his own consulting company, Bruscar Technologies LLC, and a data-center operations executive with experience in the financial-services industry. “Things that should be turned off over time are not,” he says. “And unfortunately the longer they linger there, the worse the problem becomes.”
Mr. Nally once audited a data center that had more than 1,000 servers that were powered on but not identifiable on the network. They hadn’t even been configured with domain-name-system software—the Internet’s equivalent of a telephone number. “They would have never been found by any other methodology other than walking around with a clipboard,” Mr. Nally says.
I’m hopeful that increased attention to this issue will result in more management focus and better application of computing resources to solve business problems. That’s one reason why I’m teaching my upcoming online class (October 5 to November 13, 2015) titled Modernizing enterprise data centers for fun and profit. Also see my recent article in DCD Focus with the same title.
Twenty first century data centers are the crown jewels of global business. No modern company can run without them, and they deliver business value vastly exceeding their costs. The big hyperscale computing companies (like Google, Microsoft, Amazon, and Facebook) are the best in the industry at extracting that business value, but for many enterprises whose primary business is not computing, the story is more complicated.
If you work in such a company, you know that data centers are often strikingly inefficient. While they may still be profitable, their performance still falls far short of what is possible. And by “far short” I don’t mean by 10 or 20 percent, I mean by a factor of ten or more.
The course will teach people how to bring their data centers into the twenty first century, turning them from cost centers into cost-reducing profit centers.
Cern datacenter Photo credit: By Hugovanmeijeren (Own work) [GFDL or CC-BY-SA-3.0-2.5-2.0-1.0], via Wikimedia Commons
I’ve been struggling for years to convince executives in large enterprises to fix the incentive, reporting, and other structural problems in data centers. The folks in the data center know that there are issues (like having separate budgets for IT and facilities) but fixing those problems is “above their pay grade”. That’s why we’ve been studying the clever things eBay has done to change their organization to take maximal advantage of IT, as summarized in this case study from 2013:
Schuetz, Nicole, Anna Kovaleva, and Jonathan Koomey. 2013. eBay: A Case Study of Organizational Change Underlying Technical Infrastructure Optimization. Stanford, CA: Steyer-Taylor Center for Energy Policy and Finance, Stanford University. September 26.
That’s also why I’ve worked with Heatspring and Data Center Dynamics to develop the following online course, which starts October 5th and goes until November 13th, 2015:
This is a unique opportunity to spend seven weeks learning from Jonathan Koomey, a Research Fellow at the Steyer-Taylor Center for Energy Policy and Finance at Stanford University, and one of the foremost international experts on data center energy use, efficiency, organization, and management.
This course provides a road map for managers, directors, and senior directors in Technology Business Management (TBM), drawing upon real-world experiences from industry-leading companies like eBay and Google. The course is designed to help transform enterprise IT into a cost-reducing profit center by mapping the costs and performance of IT in terms of business KPIs.
Executives in this course will gain access to templates and best practices used by leaders in your data center. You’ll use these templates to complete a Capstone Project, in which you will propose management changes for your organization to help increase business agility, reduce costs, and move their internal IT organization from being a cost center to a profit center.
I’m excited about this class, but we need more signups by early October. Please spread the word by sending this blog post to upper level management in the company where you work.
This morning we did an AMA (Ask Me Anything) on Reddit, focusing on our Oil Climate Index (OCI) and the related interactive web tool. I hadn’t done one of these before, and I was pleasantly surprised at how well it turned out (go here to take a look). Anyone can ask questions and we got to answer them. The questions and answers remain up for others to examine after the AMA is done. Some questions were a bit far afield, but there were also many excellent ones. For those interested in the OCI, it’s a good place to learn more.
The team at Carnegie just created a useful infographic for our Oil-Climate Index and the accompanying OCI web tool. I’m often skeptical of infographics, because they can be oversimplified, but this one seems to capture the essence of our work without doing violence to accuracy. Please let me know if you agree!
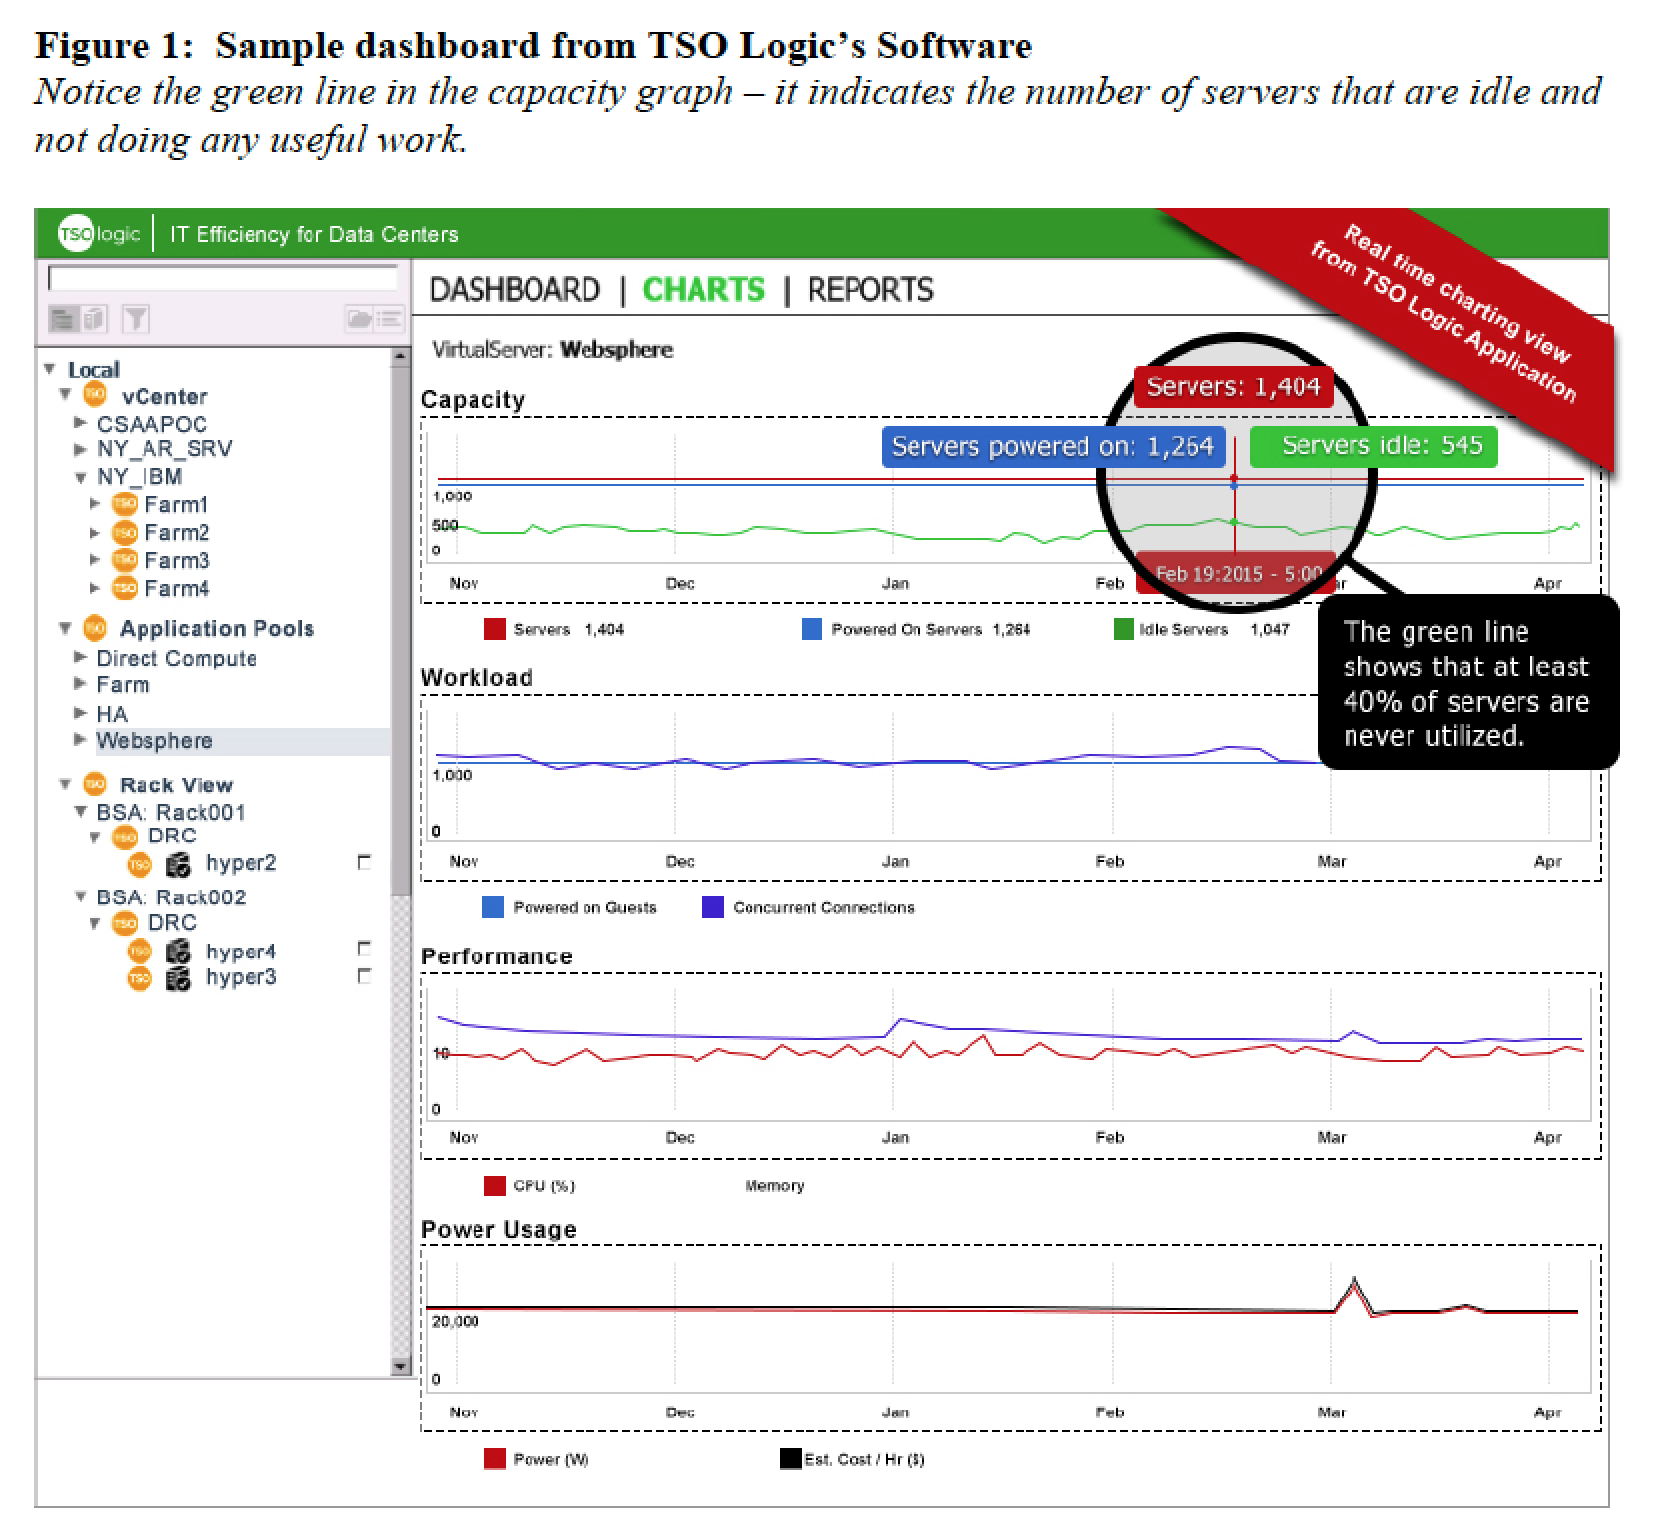
The Uptime Institute and McKinsey and Company had earlier estimated that up to 30% of servers in many data centers were comatose, and new data from TSO Logic confirms these estimates. Our initial sample size is small (4000 servers) but the data show that 30% of the servers in this sample hadn’t been used in more than six months.
If this finding holds up for larger sample sizes (and we expect it will) then about 10 million servers in the world are comatose, stranding tens of billions of dollars of data center capital and wasting billions every year in operating cost and software license costs.
In the twenty first century, every company is an IT company, but too many enterprises settle for vast inefficiencies in their IT infrastructure. The existence of so many comatose servers is a clear indication that the ways IT resources in enterprises are designed, built, provisioned, and operated need to change. The needed changes are not primarily technical, but revolve instead around management practices, information flows, and incentives. To learn how to implement such changes, see my Fall 2015 online class titled Management Essentials for Transforming Enterprise IT.
We will update the analysis as the data set grows, with the next update due in Fall 2015.


